GGT-Blood-Test-Gamma-Glutamyl-Transferase-Analysis

GGT Blood Test: Gamma-Glutamyl Transferase Analysis

The GGT blood test measures gamma-glutamyl transferase levels to assess liver function and detect bile duct problems. This essential liver enzyme marker helps diagnose alcohol-related liver damage, bile duct obstruction, and various liver conditions. Understanding your GGT levels through proper analysis can provide crucial insights into your hepatic health and guide appropriate treatment decisions.

In this comprehensive guide, you’ll discover:

🔍 What GGT is and why it matters for liver health
📊 How to interpret GGT test results accurately
🩺 Conditions that cause elevated GGT levels
💡 Lifestyle factors that affect GGT measurements
📈 Normal ranges based on age, gender, and health status
🛠️ Our free GGT calculator tool for personalized analysis

Liver Enzyme Normal Range Estimator

Liver Enzyme Normal Range Estimator

Assess your liver health by estimating normal enzyme ranges based on your profile

Demographic Information

Medical History

/

Liver Enzyme Levels

20 U/L
25 U/L
80 U/L
30 U/L
0.8 mg/dL

Your Liver Health Assessment

Normal
Low Risk Moderate Risk High Risk
ALT
20 U/L
Normal: 7-56 U/L
AST
25 U/L
Normal: 10-40 U/L
ALP
80 U/L
Normal: 44-147 U/L
GGT
30 U/L
Normal: 9-48 U/L
Bilirubin
0.8 mg/dL
Normal: 0.1-1.2 mg/dL

Interpretation

Based on your inputs, your liver enzyme levels appear to be within normal ranges. This suggests good liver health. However, this assessment is based on estimated ranges and should not replace professional medical advice.

Personalized Recommendations

Continue maintaining a healthy lifestyle with balanced nutrition and regular physical activity. Consider regular check-ups to monitor your liver health.

Disclaimer: This tool provides estimated information only and is not a substitute for professional medical advice. Always consult with a qualified healthcare provider for diagnosis and treatment of medical conditions.

Try More Free Tools:

Free-GGT-Blood-Test-Gamma-Glutamyl-Transferase-Analysis

What is Gamma-Glutamyl Transferase (GGT) and Why is it Important?

Gamma-glutamyl transferase (GGT) is a crucial enzyme found primarily in your liver, but also present in the kidneys, pancreas, and spleen. This membrane-bound enzyme plays a vital role in glutathione metabolism and the transfer of amino acids across cellular membranes. GGT serves as a sensitive marker for hepatobiliary disease and is particularly valuable for detecting bile duct obstruction and alcohol-related liver damage.

GGT exists in multiple molecular forms and is involved in the gamma-glutamyl cycle, which helps maintain intracellular glutathione levels – your body’s master antioxidant. When liver cells are damaged or bile flow is obstructed, GGT leaks into the bloodstream, causing elevated levels that can be detected through blood tests.

Key facts about GGT importance:

📌 GGT is the most sensitive enzyme marker for hepatobiliary disease
📌 It helps differentiate liver origin from bone origin of alkaline phosphatase elevation
📌 GGT levels can detect alcohol consumption and alcoholic liver disease
📌 It serves as an early warning sign for various liver conditions
📌 GGT elevation often precedes other liver enzyme abnormalities

GGT measurement provides critical clinical information that helps healthcare providers assess liver health, monitor treatment effectiveness, and detect potential problems before they become severe. The test is particularly valuable because it can identify issues that might not yet be apparent through symptoms or other diagnostic markers.

How Does the GGT Blood Test Work and What Does It Measure?

The GGT blood test is a simple blood draw that measures the level of gamma-glutamyl transferase enzyme in your bloodstream. This clinical laboratory test analyzes a serum sample using enzymatic rate methodology, where the enzyme’s activity is measured rather than its concentration. The test principle involves GGT catalyzing the transfer of gamma-glutamyl group from substrates like gamma-glutamyl-p-nitroanilide to glycylglycine, producing colored products that can be measured spectrophotometrically.

When your healthcare provider orders a GGT test, a phlebotomist will collect a blood sample from your arm vein. The sample is sent to a laboratory where it’s processed and analyzed using automated clinical chemistry analyzers. Results are typically available within 24-48 hours and reported in units per liter (U/L) of blood. The test requires no special preparation beyond potential fasting instructions, though some providers may recommend abstaining from alcohol for 24 hours before testing.

The GGT test measures:

🔬 Enzyme activity levels in blood serum
🔬 Liver cell integrity and potential damage
🔬 Biliary system function and bile flow
🔬 Response to hepatotoxic substances including alcohol
🔬 Progression or improvement of liver conditions

Modern laboratory techniques use standardized methods to ensure accurate and reproducible GGT measurements. The most common methodology involves kinetic measurement of p-nitroaniline release at 405-410 nm wavelength. Quality control measures include calibration with known standards and participation in proficiency testing programs to maintain accuracy across different laboratories.

What Are Normal GGT Levels by Age and Gender?

Normal GGT levels vary significantly based on age, gender, and laboratory reference ranges. Generally, adult males have slightly higher normal values than females due to hormonal differences and typically higher body mass. GGT levels also naturally increase with age as liver function gradually changes over time.

Typical reference ranges for GGT levels:

Age GroupMale Normal Range (U/L)Female Normal Range (U/L)
0-6 months12-12212-122
6-12 months1-251-25
1-3 years1-181-18
4-6 years3-153-15
7-9 years4-164-16
10-13 years4-204-20
14-17 years3-253-20
18+ years8-615-36
60+ years10-758-45

Factors affecting normal GGT ranges:

📊 Laboratory methodology and reference standards
📊 Population demographics and geographic location
📊 Body mass index and metabolic health
📊 Genetic factors and ethnic background
📊 Medication usage and supplement intake

It’s crucial to interpret GGT results using the specific reference range provided by the laboratory that performed the test, as different methods and populations can yield varying normal values. Many laboratories establish their own reference ranges based on local population studies, which may differ from generalized standards.

What Causes Elevated GGT Levels and What Do They Indicate?

Elevated GGT levels indicate increased enzyme release from damaged liver cells or biliary epithelial cells. While GGT is highly sensitive for liver conditions, it lacks specificity – meaning elevated levels signal a problem but don’t pinpoint the exact cause. The degree of elevation often correlates with the severity of the underlying condition, though this isn’t always consistent.

Common causes of elevated GGT levels:

🚨 Alcoholic liver disease and excessive alcohol consumption
🚨 Non-alcoholic fatty liver disease (NAFLD)
🚨 Viral hepatitis (Hepatitis A, B, C)
🚨 Bile duct obstruction or cholestasis
🚨 Medication-induced liver injury
🚨 Pancreatitis or pancreatic disease
🚨 Congestive heart failure
🚨 Metabolic syndrome and obesity

GGT elevation patterns can provide clinical clues about the underlying condition. Markedly elevated GGT (5-10 times upper limit of normal) typically suggests bile duct obstruction, alcoholic hepatitis, or drug-induced liver injury. Moderate elevation (2-5 times normal) often indicates viral hepatitis, non-alcoholic steatohepatitis, or early alcoholic liver disease. Mild elevation (1-2 times normal) may reflect non-alcoholic fatty liver, medication effects, or early-stage liver conditions.

Clinical significance of GGT elevation:

🔍 Early detection of alcohol abuse and alcoholic liver disease
🔍 Monitoring progression of chronic liver conditions
🔍 Assessing response to treatment for liver diseases
🔍 Predicting cardiovascular disease risk in some populations
🔍 Identifying hepatotoxic effects of medications

GGT elevation must be interpreted in context with other liver enzymes, clinical symptoms, and patient history. Isolated GGT elevation without other liver enzyme abnormalities may suggest specific conditions like alcohol use, certain medication effects, or early biliary tract disease.

How Does Alcohol Consumption Affect GGT Test Results?

Alcohol consumption has a profound effect on GGT levels due to the enzyme’s induction by ethanol and the direct hepatotoxic effects of alcohol. GGT is considered one of the most sensitive markers for detecting excessive alcohol intake and monitoring abstinence in individuals with alcohol use disorder. The relationship between alcohol consumption and GGT elevation is dose-dependent, with higher intake generally causing greater enzyme elevation.

Alcohol affects GGT through multiple mechanisms:

🍺 Direct induction of GGT synthesis in liver cells
🍺 Hepatocellular damage and membrane disruption
🍺 Oxidative stress and glutathione depletion
🍺 Biliary tract pressure changes and cholestasis
🍺 Pancreatic involvement and secondary liver effects

The timeline of GGT elevation following alcohol consumption varies by individual factors, but typically:

⏱️ Acute binge drinking can elevate GGT within 24-48 hours
⏱️ Regular heavy drinking causes sustained GGT elevation
⏱️ GGT levels may remain elevated for several weeks after alcohol cessation
⏱️ Complete normalization can take 2-6 months of abstinence

Clinical patterns of alcohol-related GGT elevation:

📈 GGT typically rises before other liver enzymes in early alcohol-related liver disease
📈 The AST/ALT ratio is often greater than 2:1 in alcoholic hepatitis
📈 GGT elevation out of proportion to ALP suggests alcohol rather than obstruction
📈 Isolated GGT elevation with normal other enzymes strongly suggests alcohol

GGT monitoring is valuable in alcohol treatment programs, as decreasing levels confirm abstinence while rising levels may indicate relapse. However, GGT elevation alone cannot definitively diagnose alcohol abuse, as other conditions can cause similar patterns.

What Medications Can Cause Elevated GGT Levels?

Many commonly prescribed medications can cause elevated GGT levels through various mechanisms, including enzyme induction, hepatocellular damage, cholestasis, or mixed liver injury. Understanding medication effects on GGT is crucial for proper test interpretation and avoiding misdiagnosis.

Common medications that elevate GGT:

💊 Anticonvulsants: Phenytoin, phenobarbital, carbamazepine
💊 Antibiotics: Erythromycin, nitrofurantoin, isoniazid
💊 Antifungals: Fluconazole, itraconazole
💊 Statins: Atorvastatin, simvastatin, rosuvastatin
💊 NSAIDs: Acetaminophen (in overdose), diclofenac
💊 Antidepressants: Amitriptyline, bupropion
💊 Cardiovascular drugs: Amiodarone, verapamil, nifedipine

Mechanisms of medication-induced GGT elevation:

🔬 Enzyme induction without liver damage (phenytoin, phenobarbital)
🔬 Hepatocellular necrosis and inflammation (isoniazid, acetaminophen)
🔬 Cholestatic liver injury (erythromycin, amoxicillin-clavulanate)
🔬 Mixed hepatocellular-cholestatic injury (sulfonamides, phenytoin)
🔬 Steatosis and mitochondrial damage (valproate, tetracycline)

Clinical considerations for medication-related GGT elevation:

📋 Timing of GGT elevation relative to medication initiation
📋 Pattern of other liver enzyme abnormalities
📋 Presence of clinical symptoms suggesting liver injury
📋 Dose relationship and duration of therapy
📋 Potential drug interactions affecting metabolism

When medication-induced GGT elevation is suspected, healthcare providers must weigh the benefits of continued therapy against potential liver risks. In many cases, mild asymptomatic GGT elevation without other enzyme abnormalities may not require medication discontinuation but does warrant monitoring.

How is the GGT Test Used in Diagnosing Liver Disease?

The GGT test plays several important roles in diagnosing and managing liver disease, serving as a sensitive screening tool, diagnostic differentiator, and monitoring parameter. Its unique properties make it particularly valuable in specific clinical scenarios where other liver tests may be ambiguous or normal.

Diagnostic applications of GGT testing:

🩺 Differentiating liver from bone origin of alkaline phosphatase elevation
🩺 Detecting early alcohol-related liver damage
🩺 Screening for biliary tract obstruction and cholestasis
🩺 Monitoring progression of chronic liver diseases
🩺 Assessing medication-induced hepatotoxicity

GGT in specific liver conditions:

🔎 Alcoholic liver disease: GGT is typically elevated out of proportion to other enzymes
🔎 Viral hepatitis: GGT elevation is usually moderate and follows ALT/AST patterns
🔎 Biliary obstruction: Marked GGT elevation alongside ALP elevation
🔎 Non-alcoholic fatty liver: Mild to moderate GGT elevation common
🔎 Autoimmune hepatitis: Variable GGT elevation depending on disease activity

Clinical interpretation patterns:

📊 Isolated GGT elevation: Suggests alcohol, medications, or early biliary disease
📊 GGT elevated with ALP: Indicates hepatobiliary disease, helps confirm liver origin
📊 GGT elevated with ALT/AST: Suggests hepatocellular damage pattern
📊 GGT normal with elevated ALP: Points toward bone origin of ALP

GGT’s high sensitivity makes it valuable for detecting subclinical liver involvement in systemic conditions like heart failure, sepsis, and metastatic cancer. However, its low specificity means abnormal results always require correlation with clinical findings and additional testing.

What Other Conditions Besides Liver Disease Can Cause High GGT?

While GGT is primarily considered a liver enzyme, elevated levels can occur in various non-hepatic conditions due to the enzyme’s presence in other tissues and its relationship to systemic metabolic processes. Recognizing these non-liver causes is essential for proper test interpretation and avoiding unnecessary liver-focused investigations.

Non-hepatic conditions associated with GGT elevation:

❤️ Cardiovascular disease and hypertension
❤️ Diabetes mellitus and metabolic syndrome
❤️ Chronic kidney disease and renal impairment
❤️ Chronic obstructive pulmonary disease (COPD)
❤️ Neurological conditions including dementia and stroke
❤️ Certain cancers including pancreatic, renal, and prostate

Mechanisms for non-hepatic GGT elevation:

🔬 Systemic oxidative stress and inflammation
🔬 Enzyme induction by medications used for non-liver conditions
🔬 Release from non-hepatic tissues (kidney, pancreas, brain)
🔬 Metabolic abnormalities affecting glutathione metabolism
🔬 Association with cardiovascular risk factors

GGT as a marker beyond liver disease:

📈 Independent predictor of cardiovascular events and mortality
📈 Association with diabetes incidence and metabolic syndrome
📈 Correlation with all-cause mortality in general populations
📈 Potential marker for oxidative stress in various diseases

Clinical approach to isolated GGT elevation:

✅ Exclude liver and biliary disease through history and examination
✅ Review medication list for potential inductors
✅ Assess alcohol consumption patterns honestly
✅ Evaluate for metabolic syndrome components
✅ Consider non-hepatic sources if liver evaluation is negative

Understanding these non-hepatic associations helps clinicians avoid over-investigation of incidental GGT elevation when clinical context suggests alternative explanations.

What is the Relationship Between GGT and Other Liver Enzymes?

GGT must always be interpreted in context with other liver enzymes to determine the pattern of liver injury and narrow differential diagnoses. The relationship between GGT and enzymes like ALT, AST, ALP, and bilirubin provides crucial diagnostic information that guides further evaluation and management.

Key enzyme relationships and patterns:

🔄 GGT and Alkaline Phosphatase (ALP): When both are elevated, confirms liver origin of ALP; when ALP is elevated with normal GGT, suggests bone origin
🔄 GGT and ALT/AST: GGT elevation with predominant ALT/AST suggests hepatocellular pattern; disproportionate GGT elevation suggests cholestatic or alcoholic pattern
🔄 GGT and Bilirubin: Parallel elevation suggests significant biliary obstruction or severe hepatocellular dysfunction

Common liver enzyme patterns and their interpretations:

🔹 Hepatocellular pattern: ALT/AST elevated > ALP/GGT elevation (viral hepatitis, toxic injury)
🔹 Cholestatic pattern: ALP/GGT elevated > ALT/AST elevation (biliary obstruction, drug cholestasis)
🔹 Infiltrative pattern: Marked ALP/GGT elevation with mild ALT/AST elevation (infiltrative diseases, metastases)
🔹 Alcoholic pattern: AST:ALT ratio >2:1 with disproportionate GGT elevation (alcoholic liver disease)

The GGT/ALP ratio can provide additional diagnostic clues:

📏 GGT/ALP ratio >2.5 suggests alcohol-related liver disease
📏 GGT/ALP ratio <0.5 suggests bone disease or childhood growth
📏 GGT/ALP ratio 0.5-2.5 suggests various hepatobiliary conditions

Serial monitoring of enzyme relationships helps track disease progression and treatment response. For example, in resolving biliary obstruction, GGT and ALP should decline together, while persistent GGT elevation after ALP normalization might suggest ongoing low-grade injury or enzyme induction.

How Can I Lower My GGT Levels Naturally?

Lowering elevated GGT levels typically involves addressing the underlying cause, but several evidence-based lifestyle interventions can help reduce levels naturally. These approaches focus on reducing liver stress, improving metabolic health, and supporting the body’s detoxification pathways.

Effective strategies to lower GGT naturally:

🥗 Dietary modifications:

  • Reduce saturated fats and processed foods
  • Increase consumption of cruciferous vegetables
  • Incorporate foods rich in antioxidants
  • Maintain adequate protein intake
  • Limit simple carbohydrates and sugars

🏃 Physical activity and weight management:

  • Regular aerobic exercise (150+ minutes weekly)
  • Resistance training 2-3 times weekly
  • Achieving and maintaining healthy BMI
  • Reducing visceral adipose tissue

🚫 Substance avoidance:

  • Complete alcohol abstinence if levels are alcohol-related
  • Smoking cessation and tobacco avoidance
  • Careful medication review with healthcare provider
  • Limiting environmental toxin exposure

🌿 Supportive supplements (under medical guidance):

  • Milk thistle (silymarin) for liver support
  • N-acetylcysteine to support glutathione production
  • Vitamin E for non-alcoholic fatty liver disease
  • Omega-3 fatty acids to reduce inflammation
  • Coffee consumption (associated with lower GGT)

Lifestyle intervention studies show:

📉 Weight loss of 5-10% can reduce GGT by 20-40%
📉 Alcohol abstinence for 2-3 months normalizes alcohol-induced elevation
📉 Mediterranean diet adoption reduces GGT within 8-12 weeks
📉 Regular exercise lowers GGT independently of weight loss

Monitoring progress through repeat testing every 4-12 weeks during interventions helps assess effectiveness. GGT reduction typically lags behind other metabolic improvements, so persistence with lifestyle changes is essential for sustained benefit.

What is the Prognostic Value of GGT in Chronic Diseases?

Beyond its diagnostic role in liver conditions, GGT has emerging prognostic value for various chronic diseases, serving as a marker of oxidative stress, inflammation, and disease severity. Numerous epidemiological studies have established associations between GGT levels and long-term health outcomes across multiple organ systems.

GGT as a prognostic marker in specific conditions:

💔 Cardiovascular disease: Elevated GGT predicts future heart attacks, strokes, and cardiovascular mortality independent of traditional risk factors
🩺 Diabetes and metabolic syndrome: Higher GGT levels correlate with diabetes development, insulin resistance, and microvascular complications
🧠 Neurological disorders: Elevated GGT associates with increased stroke risk, cognitive decline, and neurodegenerative diseases
🫁 Respiratory diseases: GGT elevation predicts mortality in COPD and correlates with disease severity
🎗️ Cancer outcomes: Pre-treatment GGT levels predict survival in various cancers including liver, pancreatic, and colorectal

Proposed mechanisms for GGT’s prognostic value:

🔎 Marker of subclinical oxidative stress and inflammation
🔎 Indicator of glutathione depletion and impaired antioxidant defense
🔎 Surrogate for metabolic syndrome components and insulin resistance
🔎 Reflection of subclinical liver involvement in systemic diseases
🔎 Association with lifestyle factors that affect chronic disease risk

Clinical implications of GGT’s prognostic value:

📊 May help stratify cardiovascular risk in intermediate-risk individuals
📊 Could inform intensity of preventive interventions
📊 Might serve as monitoring parameter during chronic disease management
📊 Potential tool for assessing effectiveness of lifestyle interventions

While GGT shows promise as a prognostic marker, it’s not yet routinely used for risk stratification in most clinical guidelines. However, recognizing these associations can provide additional context when interpreting GGT results in patients with chronic conditions.

How Often Should GGT Levels Be Monitored?

The frequency of GGT monitoring depends on the clinical indication, baseline levels, and response to interventions. There are no universal guidelines for GGT testing frequency, so monitoring schedules should be individualized based on specific clinical scenarios and treatment goals.

Recommended monitoring frequencies by indication:

🩺 Baseline elevated GGT with no clear cause: Repeat in 2-4 weeks to confirm persistence
🩺 Alcohol-related elevation with abstinence: Monthly for 3 months, then every 3 months until normalized
🩺 Medication monitoring: Baseline before starting, then at 1-3 months, then every 6-12 months if stable
🩺 Chronic liver disease: Every 3-6 months depending on stability and treatment
🩺 Metabolic syndrome/NAFLD: Every 6-12 months as part of metabolic monitoring

Factors influencing monitoring frequency:

📈 Degree of elevation (mild vs. marked)
📈 Presence of symptoms or other abnormal tests
📈 Response to interventions or treatment changes
📈 Underlying condition stability or progression
📈 Medication changes with hepatotoxic potential

Situations requiring more frequent monitoring:

🔔 Rapidly rising GGT levels
🔔 Development of new symptoms
🔔 Initiation of potentially hepatotoxic medications
🔔 Known progressive liver disease
🔔 During treatment for alcohol use disorder

For individuals with persistently normal GGT and no risk factors, routine monitoring isn’t typically necessary unless clinical circumstances change. The test should be repeated when new symptoms develop or when factors that might affect liver health change significantly.

What Are the Limitations of GGT Testing?

While GGT testing provides valuable clinical information, it has several important limitations that affect its interpretation and utility. Understanding these limitations helps prevent overinterpretation and guides appropriate use in clinical practice.

Key limitations of GGT testing:

📝 Lack of specificity: Elevated GGT doesn’t pinpoint a specific diagnosis
📝 Wide normal range: Overlap between healthy and diseased populations
📝 Numerous non-hepatic influences: Medications, non-liver diseases, lifestyle factors
📝 Variable individual baseline: Some people naturally have higher or lower levels
📝 Poor correlation with histology: GGT levels don’t always reflect liver damage severity
📝 Limited prognostic value alone: Must be interpreted with other clinical data

Situations where GGT testing has reduced utility:

🔍 Screening asymptomatic individuals without risk factors
🔍 Isolated mild elevation without other abnormalities
🔍 Monitoring specific liver conditions with better biomarkers available
🔍 Assessing liver fibrosis severity (better tools available)
🔍 Differentiating between specific liver diseases alone

Comparative limitations with other liver tests:

📊 Less specific for hepatocellular damage than ALT
📊 Less specific for cholestasis than ALP in some contexts
📊 More variable than AST in cardiac and muscle conditions
📊 More affected by enzyme inducers than most other liver enzymes

Despite these limitations, GGT remains valuable when used appropriately – particularly for detecting biliary tract disease, confirming liver origin of ALP elevation, and monitoring alcohol-related liver injury. The key is recognizing its role as a piece of the diagnostic puzzle rather than a standalone test.

How to Use Our Free GGT Blood Test Calculator

Our free GGT Blood Test Calculator provides personalized interpretation of your GGT results based on your specific demographics, lifestyle factors, and complete liver enzyme profile. This sophisticated tool goes beyond simple reference ranges to offer contextualized analysis that considers the multiple factors influencing GGT levels.

To use the calculator effectively:

  1. Enter your demographic information including age and gender
  2. Provide your exact GGT value and measurement units
  3. Input other available liver enzyme results (ALT, AST, ALP, bilirubin)
  4. Include relevant medical history and lifestyle factors
  5. Review your personalized assessment and recommendations

The calculator analyzes:

🧮 Your GGT result against age and gender-specific norms
🧮 Patterns with other liver enzymes for differential diagnosis
🧮 Potential causes based on your specific risk factors
🧮 Appropriate follow-up actions based on result severity
🧮 Lifestyle factors that could be influencing your levels

The algorithm incorporates:

📱 Evidence-based medical guidelines for liver test interpretation
📱 Statistical modeling of population-based reference ranges
📱 Clinical decision support rules for pattern recognition
📱 Risk stratification based on degree and pattern of elevation
📱 Personalized recommendations based on individual factors

For accurate results, ensure you:

  • Use recent laboratory results (within 30 days)
  • Input all available liver enzyme data
  • Provide honest information about alcohol consumption
  • Include complete medication and supplement list
  • Report any relevant symptoms you’re experiencing

The calculator is designed for educational purposes and should not replace professional medical evaluation. Always discuss abnormal results with your healthcare provider for proper diagnosis and management.

Understanding Your GGT Calculator Results

Interpreting your GGT calculator results requires understanding the different components of your personalized report. The calculator provides a comprehensive analysis that places your GGT level in clinical context based on your unique profile.

Key components of your results:

📋 GGT Level Classification: Normal, mildly elevated, moderately elevated, or markedly elevated based on age/gender norms
📋 Pattern Analysis: Hepatocellular, cholestatic, mixed, or isolated GGT elevation pattern
📋 Differential Diagnosis: Ranked list of potential causes based on your specific profile
📋 Risk Stratification: Low, intermediate, or high risk for significant liver pathology
📋 Action Plan: Recommended next steps based on result severity and pattern

Result interpretations by classification:

🟢 Normal GGT: Unlikely significant liver disease, routine monitoring if risk factors present
🟡 Mild elevation: Possible early liver involvement, medications, alcohol, or metabolic causes
🟠 Moderate elevation: Likely significant liver condition requiring medical evaluation
🔴 Marked elevation: High probability of significant liver disease requiring prompt medical attention

The calculator also provides:

📊 Comparison to population percentiles for your demographic
📊 Trend analysis if previous results are available
📊 Specific factors in your history contributing to elevation
📊 Evidence-based timeline for follow-up testing
📊 Lifestyle modifications likely to improve levels

Understanding the confidence level of your assessment is important. The calculator indicates when results are:

  • Highly reliable (complete data, clear pattern)
  • Moderately reliable (some missing data, common pattern)
  • Less reliable (incomplete data, ambiguous pattern)

Your results include specific recommendations for:

  • When to consult a healthcare provider
  • What additional testing might be helpful
  • Which specialists to consider if needed
  • Lifestyle changes that may help
  • Monitoring frequency suggested

Remember that calculator results represent probability estimates based on population data and clinical algorithms. Individual variations mean that professional medical evaluation is always recommended for abnormal results.

Frequently Asked Questions About GGT Blood Tests

What is the most common cause of elevated GGT?
The most common cause of elevated GGT is excessive alcohol consumption. Other frequent causes include non-alcoholic fatty liver disease, medications that induce liver enzymes, and biliary tract disorders. The pattern of elevation alongside other liver tests helps narrow the specific cause.

Can GGT be elevated without liver disease?
Yes, GGT can be elevated without primary liver disease. Common non-liver causes include pancreatic disease, kidney impairment, heart failure, chronic obstructive pulmonary disease, and various medications. Even strenuous exercise can temporarily elevate GGT in some individuals.

How long does it take for GGT to return to normal after stopping alcohol?
GGT typically begins decreasing within 2-4 weeks of alcohol cessation and may normalize within 2-5 months, depending on the initial level and individual factors. Heavy long-term drinkers might require 6 months or longer for complete normalization.

What is a dangerously high GGT level?
GGT levels exceeding 5 times the upper limit of normal are concerning and warrant prompt medical evaluation. Levels above 10 times normal often indicate significant liver pathology requiring immediate attention. However, the degree of elevation doesn’t always correlate with severity, and clinical context is essential.

Can dehydration cause high GGT?
Mild dehydration typically doesn’t significantly affect GGT levels, but severe dehydration with prerenal azotemia can cause modest GGT elevation due to reduced hepatic blood flow and mild liver injury. Proper hydration is always recommended before blood testing for accurate results.

Does coffee affect GGT levels?
Interestingly, coffee consumption is associated with lower GGT levels in multiple studies. The protective effect appears dose-dependent, with 2-4 cups daily showing the strongest association. The mechanism may involve coffee’s antioxidant properties and effects on liver enzymes.

Is GGT tested in routine blood work?
GGT is not typically included in standard comprehensive metabolic panels or routine blood work. It’s usually added when liver disease is suspected, when alkaline phosphatase is elevated, or when monitoring specific conditions like alcohol use disorder or medication effects.

Disclaimer: This article provides educational information only and is not a substitute for professional medical advice. The calculator tool offers estimates based on algorithms and should not replace clinical evaluation by healthcare providers.

IGA-Blood-Test-Immunogl-bulin-A-Deficiency-Testing

IGA Blood Test: Immunoglobulin A Deficiency Testing

Immunoglobulin A (IgA) deficiency represents the most common primary immunodeficiency disorder worldwide, affecting approximately 1 in 600 people. This comprehensive guide explores IgA testing, deficiency implications, and provides a specialized risk assessment calculator to evaluate your potential for this immune system disorder. Understanding your IgA status is crucial for maintaining optimal immune function and preventing recurrent infections.

What You’ll Learn About IgA Deficiency:

• Understanding Immunoglobulin A and its protective functions
• Recognizing IgA deficiency symptoms and health implications
• Interpreting IgA blood test results and normal ranges
• Managing IgA deficiency through lifestyle and medical interventions
• Assessing your personal risk factors through our specialized calculator
• Latest treatment advances and research developments

Immune Deficiency Risk Calculator

Immune Deficiency Risk Calculator

Assess your risk factors for immune system deficiencies

Demographic Information

cm
ft/in
kg
lbs

Medical History & Lifestyle

5
7 hours

Your Immune Deficiency Risk Assessment

0
Low Risk

Interpretation of Your Results

Based on the information provided, your immune deficiency risk appears to be low. Continue maintaining healthy lifestyle habits and regular check-ups.

Primary Risk Factors

  • None identified

Recommendations

  • Maintain current lifestyle
  • Regular health screenings

Disclaimer: This calculator provides an estimate based on the information you provide and is not a substitute for professional medical advice. Always consult with a healthcare provider for personalized medical guidance.

Try More Free Tools:

Free-IGA-Blood-Test-Immunogl-bulin-A-Deficiency-Testing

What is Immunoglobulin A and Why is it Crucial for Immune Defense?

Immunoglobulin A serves as the first line of defense in mucosal immunity, protecting respiratory, gastrointestinal, and genitourinary tracts from pathogens. This antibody class constitutes approximately 15% of total immunoglobulins in the body, with two main forms: serum IgA and secretory IgA. Secretory IgA plays a particularly vital role in mucosal surfaces, where it prevents microbial attachment, neutralizes toxins, and regulates immune responses without triggering inflammation.

The importance of IgA extends beyond infection prevention. Recent research indicates IgA participates in maintaining gut microbiome balance, preventing inappropriate immune responses to commensal bacteria, and may influence the development of autoimmune conditions. Unlike other immunoglobulins, IgA exists primarily in dimeric or polymeric forms that resist proteolytic enzymes in mucosal secretions, making it uniquely suited for its protective roles.

Key Functions of Immunoglobulin A in the Body:

🛡️ Mucosal Surface Protection – Forms a barrier at entry points for pathogens
🛡️ Immune Exclusion – Prevents microorganisms from adhering to epithelial cells
🛡️ Anti-inflammatory Activity – Modulates immune responses without tissue damage
🛡️ Microbiome Regulation – Maintains balanced gut flora and prevents dysbiosis
🛡️ Viral Neutralization – Blocks viral entry and replication at mucosal surfaces

How Does IgA Deficiency Develop and What Are the Underlying Causes?

Selective IgA deficiency manifests when the immune system fails to produce sufficient Immunoglobulin A antibodies while other immunoglobulin levels remain normal. The condition typically results from impaired terminal differentiation of B lymphocytes into IgA-producing plasma cells. Genetic factors play a significant role, with multiple gene variants identified in HLA class II and III regions on chromosome 6. These genetic predispositions interact with environmental triggers, though specific mechanisms remain incompletely understood.

The condition can present as primary (congenital) or secondary (acquired). Primary IgA deficiency often follows autosomal dominant or recessive inheritance patterns with variable penetrance. Secondary causes include medications (especially anticonvulsants), viral infections (Epstein-Barr virus, cytomegalovirus), and certain autoimmune conditions. Interestingly, some individuals may experience transient IgA deficiency that resolves spontaneously, particularly in children under four years old.

Primary Risk Factors for Developing IgA Deficiency:

🧬 Genetic Predisposition – Family history of immunodeficiency or autoimmune disorders
🧬 Chromosome 6 Abnormalities – Variations in MHC class III region genes
🧬 Consanguinity – Increased risk in offspring of closely related parents
🧬 Autoimmune Conditions – Celiac disease, rheumatoid arthritis, lupus
🧬 Certain Medications – Anticonvulsants, sulfasalazine, penicillamine
🧬 Viral Infections – Particularly during critical developmental periods

What Symptoms Indicate Potential IgA Deficiency and When Should You Get Tested?

Clinical manifestations of IgA deficiency range from completely asymptomatic to recurrent infections, allergic conditions, and autoimmune disorders. The most common presentation involves recurrent sinopulmonary infections, including sinusitis, otitis media, bronchitis, and pneumonia. Gastrointestinal symptoms frequently include chronic diarrhea, malabsorption, and giardiasis. Many affected individuals develop allergic conditions such as asthma, allergic rhinitis, food allergies, or eczema.

Autoimmune phenomena represent another significant concern, with celiac disease occurring in 10-15 times greater frequency in IgA-deficient individuals compared to the general population. Other associated autoimmune conditions include rheumatoid arthritis, systemic lupus erythematosus, thyroiditis, and immune thrombocytopenic purpura. Some patients may experience more severe complications, including an increased risk of anaphylactic reactions to blood products containing IgA.

When to Consider IgA Deficiency Testing:

🌡️ Recurrent Infections – Frequent respiratory, sinus, or ear infections
🌡️ Chronic Gastrointestinal Issues – Persistent diarrhea, malabsorption, giardiasis
🌡️ Autoimmune Conditions – Especially celiac disease or multiple autoimmune diagnoses
🌡️ Family History – Relatives with known immunodeficiency disorders
🌡️ Unexplained Allergies – Multiple medication, food, or environmental allergies
🌡️ Before Blood Transfusion – For patients with suspected immune deficiencies

How is IgA Deficiency Diagnosed Through Blood Testing and What Do Results Mean?

Diagnosing IgA deficiency requires quantitative measurement of serum immunoglobulin levels, specifically IgA, IgG, and IgM. The diagnostic criteria include serum IgA level below 7 mg/dL (0.07 g/L) with normal IgG and IgM levels in individuals over four years old. Testing typically involves blood drawn from a vein, with samples sent to specialized laboratories for analysis via nephelometry or turbidimetry.

Interpreting results requires understanding age-specific reference ranges, as IgA levels gradually increase from infancy through adolescence. Values between 7-70 mg/dL may indicate partial IgA deficiency, which can still confer clinical symptoms. Additional testing might include secretory IgA measurement in saliva or other secretions, subclass analysis (IgA1 and IgA2), and functional antibody response assessment following vaccination.

Understanding IgA Test Result Ranges:

📊 Normal IgA Levels – 70-400 mg/dL in adults (age-dependent ranges apply)
📊 Selective IgA Deficiency – <7 mg/dL with normal IgG and IgM
📊 Partial IgA Deficiency – 7-70 mg/dL with clinical symptoms
📊 Transient IgA Deficiency – Low levels that normalize over time
📊 IgA with IgG Subclass Deficiency – Combined immunoglobulin defects

What Are the Potential Health Complications and Long-Term Implications of IgA Deficiency?

The clinical course of IgA deficiency varies significantly among individuals, with some remaining entirely asymptomatic throughout life while others experience substantial morbidity. The most serious complication involves the development of autoimmune disorders, which occur in 25-35% of affected individuals. The pathogenesis likely involves breakdown in immune tolerance, possibly due to impaired mucosal barrier function and chronic immune stimulation.

Another significant concern is the increased susceptibility to respiratory and gastrointestinal infections, which can lead to chronic lung damage, bronchiectasis, and malabsorption syndromes. Interestingly, IgA-deficient individuals demonstrate higher rates of atopic diseases and specific food allergies, particularly to milk proteins. The condition also carries implications for surgical and transfusion medicine due to the risk of anaphylactic reactions to IgA-containing blood products.

Major Health Complications Associated with IgA Deficiency:

⚠️ Recurrent Infections – Respiratory, gastrointestinal, and invasive bacterial infections
⚠️ Autoimmune Disorders – Celiac disease, SLE, rheumatoid arthritis, thyroiditis
⚠️ Allergic Conditions – Asthma, eczema, allergic rhinitis, food allergies
⚠️ Gastrointestinal Diseases – Inflammatory bowel disease, nodular lymphoid hyperplasia
⚠️ Malignancy Risk – Slightly increased risk of gastrointestinal cancers
⚠️ Transfusion Reactions – Anaphylaxis from anti-IgA antibodies

How is IgA Deficiency Managed and What Treatment Options Are Available?

Management of IgA deficiency focuses on prompt treatment of infections, prevention of complications, and monitoring for associated conditions. Antibiotic therapy plays a central role, with some patients requiring prophylactic antibiotics during high-risk periods. Immunizations remain crucial, though live vaccines require careful consideration in patients with significant clinical manifestations. For those with recurrent infections, intravenous or subcutaneous immunoglobulin replacement may be considered, though this remains controversial due to the minimal IgA content in these products.

Beyond infectious concerns, management addresses associated conditions through regular screening for celiac disease (using IgG-based testing), autoimmune disorders, and pulmonary complications. Patients should carry medical alert identification regarding their IgA status to prevent transfusion reactions. Emerging therapies include targeted immunomodulators and mucosal IgA replacement strategies, though these remain investigational approaches.

Current Treatment Strategies for IgA Deficiency:

💊 Infection Management – Prompt antibiotic therapy for bacterial infections
💊 Prophylactic Antibiotics – For patients with recurrent infections
💊 Immunoglobulin Replacement – In selected cases with IgG subclass deficiency
💊 Autoimmune Management – Standard therapies for associated conditions
💊 Vaccination – Emphasis on pneumococcal, influenza, and COVID-19 vaccines
💊 Avoidance Measures – Caution with blood products and certain medications

Can IgA Deficiency Be Prevented and What Are the Latest Research Developments?

Since primary IgA deficiency has strong genetic determinants, complete prevention remains challenging. However, understanding risk factors enables early detection and intervention to prevent complications. Genetic counseling may benefit families with known immunodeficiency disorders. Avoiding unnecessary medications associated with drug-induced IgA deficiency represents another preventive approach, particularly anticonvulsants in susceptible individuals.

Research advances have identified several promising areas, including cytokine therapies targeting B-cell differentiation, particularly TGF-β and IL-10 pathways. Gene therapy approaches remain theoretical but may eventually offer solutions for severe cases. Microbiome manipulation through probiotics and prebiotics shows potential for enhancing mucosal immunity indirectly. Recent studies also explore the relationship between IgA deficiency and COVID-19 outcomes, with mixed results regarding susceptibility and severity.

Emerging Research Directions in IgA Deficiency:

🔬 Genetic Mapping – Identifying specific gene variants and their mechanisms
🔬 Cytokine Therapies – Targeting B-cell differentiation pathways
🔬 Microbiome Modulation – Using probiotics to enhance mucosal immunity
🔬 Mucosal Vaccines – Developing vaccines that stimulate secretory IgA
🔬 Gene Editing – Theoretical approaches for genetic correction
🔬 Biologics – Monoclonal antibodies targeting specific immune pathways

How Does Our Immune Deficiency Risk Calculator Help Assess IgA Deficiency Probability?

Our specialized Immune Deficiency Risk Calculator incorporates established clinical parameters and research findings to evaluate your likelihood of having IgA deficiency or related immune disorders. This assessment tool analyzes demographic factors, medical history, lifestyle elements, and symptom patterns associated with immunoglobulin deficiencies. The algorithm weights each factor according to evidence-based medicine principles and current understanding of immunodeficiency risk stratification.

The calculator processes multiple data points including recurrent infection patterns, autoimmune conditions, family history, allergy profiles, and gastrointestinal symptoms. It generates a comprehensive risk score that categorizes results as low, moderate, or high probability of immune deficiency. This assessment serves as an educational tool rather than a diagnostic instrument, helping individuals understand when to seek formal medical evaluation and testing.

Key Parameters Analyzed by Our Risk Calculator:

📝 Demographic Factors – Age, gender, ethnicity, and family history
📝 Infection History – Frequency, severity, and types of infections
📝 Autoimmune Conditions – Presence of associated autoimmune disorders
📝 Allergy Patterns – Medication, food, and environmental allergies
📝 Gastrointestinal Symptoms – Chronic diarrhea, malabsorption, celiac disease
📝 Medication History – Drugs associated with secondary IgA deficiency

Understanding Your Calculator Results: Interpretation and Next Steps

The calculator generates a numerical score from 0-30, with higher scores indicating greater probability of immune deficiency. Scores below 10 suggest low risk, while results above 20 indicate high probability warranting medical evaluation. The assessment includes a detailed breakdown of contributing factors, highlighting areas of particular concern that should be discussed with healthcare providers.

For individuals with elevated risk scores, appropriate next steps include consultation with a primary care physician or immunology specialist, quantitative immunoglobulin testing, and potentially further immunological workup. Those with moderate scores may benefit from preventive measures and monitoring for developing symptoms. Even low-risk individuals receive education about warning signs that should prompt reevaluation.

Action Steps Based on Calculator Results:

🩺 Low Risk (0-10) – Maintain general health measures and regular checkups
🩺 Moderate Risk (11-20) – Discuss findings with primary care provider, consider baseline testing
🩺 High Risk (21-30) – Seek immunology consultation, complete immunoglobulin level testing
🩺 Regardless of Score – Document symptoms, maintain vaccination schedule, practice infection prevention

Living with IgA Deficiency: Daily Management and Quality of Life Strategies

Effective daily management of IgA deficiency focuses on infection prevention, early intervention, and monitoring for complications. Practical strategies include meticulous hand hygiene, avoiding sick contacts during high-infection seasons, and maintaining current vaccinations. Nutritional support plays an important role, with emphasis on balanced nutrition, possible probiotic supplementation, and specific dietary modifications for those with associated gastrointestinal conditions.

Psychological aspects deserve equal attention, as chronic health conditions can impact mental wellbeing. Support networks, patient education, and stress management techniques contribute significantly to quality of life. Regular medical follow-up should include annual influenza vaccination, periodic pulmonary function testing for those with respiratory symptoms, and age-appropriate cancer screening given the slightly increased malignancy risk.

Daily Management Strategies for IgA Deficiency:

✅ Infection Prevention – Hand hygiene, avoiding crowded spaces during outbreaks
✅ Medical Documentation – Carrying information about IgA status for emergencies
✅ Vaccination Schedule – Staying current with recommended immunizations
✅ Nutritional Support – Balanced diet, possible supplementation based on needs
✅ Dental Care – Regular dental visits due to increased oral infection risk
✅ Stress Management – Adequate sleep, exercise, and stress reduction techniques

Special Considerations: IgA Deficiency in Children and Pregnancy

Pediatric IgA deficiency presents unique considerations, as immunoglobulin levels normally increase gradually during childhood. Transient IgA deficiency occurs more frequently in children, with many outgrowing the condition by adolescence. Management focuses on infection control, nutritional support, and monitoring growth and development. Children with IgA deficiency should receive all routine vaccinations unless they have additional immunodeficiencies, with special attention to pneumococcal and annual influenza vaccines.

Pregnancy in women with IgA deficiency requires coordinated care between immunology and obstetrics specialists. While most women experience uncomplicated pregnancies, increased vigilance for infections is warranted. IgA deficiency does not typically affect fertility or pregnancy outcomes, though associated autoimmune conditions may require additional management. Breastfeeding remains encouraged, as although IgA doesn’t transfer significantly to breast milk, other protective factors provide immune benefits to infants.

Pediatric and Pregnancy-Specific Considerations:

👶 Childhood Monitoring – Regular growth assessment and development screening
👶 Vaccination Timing – Following standard schedules with medical guidance
👶 School Considerations – Infection prevention strategies in educational settings
🤰 Prenatal Care – Enhanced infection monitoring and autoimmune condition management
🤰 Delivery Planning – Standard delivery with attention to potential transfusion needs
🤰 Postpartum Care – Infection vigilance and autoimmune disease monitoring

Common Misconceptions About IgA Deficiency and Evidence-Based Clarifications

Several misconceptions surround IgA deficiency, potentially leading to unnecessary anxiety or inappropriate management. One common misunderstanding involves the relationship between IgA deficiency and severe combined immunodeficiency (SCID)—these represent distinct conditions with vastly different prognoses and management approaches. Another frequent misconception concerns vaccination safety, with some patients incorrectly believing they cannot receive any vaccines when in reality only specific live vaccines may require consideration.

The relationship between IgA deficiency and anaphylaxis risk also generates confusion. While anti-IgA antibodies can cause transfusion reactions, the overall risk remains low with appropriate precautions. Similarly, the prognosis of IgA deficiency is often misrepresented—most individuals lead normal lives with minimal complications when properly managed. Understanding these distinctions helps patients make informed decisions and reduces unnecessary anxiety.

Evidence-Based Clarifications of Common Misconceptions:

❌ Myth: IgA deficiency always causes serious illness
✅ Fact: Many individuals remain asymptomatic throughout life

❌ Myth: All vaccines are dangerous for IgA-deficient individuals
✅ Fact: Most vaccines are safe and recommended; only specific live vaccines require discussion

❌ Myth: IgA deficiency inevitably progresses to more severe immunodeficiency
✅ Fact: It typically remains stable without progression to other immunodeficiencies

❌ Myth: Blood transfusions are always dangerous
✅ Fact: Risk is low with proper screening and washed blood products

❌ Myth: IgA deficiency significantly shortens lifespan
✅ Fact: Most individuals have normal life expectancy with appropriate management

The Future of IgA Deficiency Diagnosis and Treatment: Emerging Technologies

Diagnostic and therapeutic approaches for IgA deficiency continue to evolve with technological advancements. Next-generation sequencing enables more comprehensive genetic analysis, identifying novel variants and improving understanding of inheritance patterns. Multiplex immunoassays provide simultaneous measurement of multiple immunoglobulin classes and subclasses with enhanced precision and efficiency. Point-of-care testing development may eventually allow rapid screening in primary care settings.

Therapeutic innovations include targeted biologic therapies that address specific immune pathway defects rather than generalized immunoglobulin replacement. Mucosal delivery systems for immunoglobulin replacement represent another promising approach, potentially providing more physiological protection at key entry points for pathogens. Gene editing technologies, while still experimental, offer theoretical potential for correcting underlying genetic defects in severe cases.

Promising Technological Advances in IgA Deficiency:

🔭 Advanced Diagnostics – Genetic sequencing, multiplex assays, point-of-care testing
🔭 Targeted Therapies – Biologics addressing specific immune pathway defects
🔭 Mucosal Immunization – Vaccines designed to stimulate secretory IgA specifically
🔭 Microbiome Engineering – Precisely targeted probiotic formulations
🔭 Gene-Based Approaches – CRISPR and other gene-editing technologies
🔭 Telemedicine Integration – Remote monitoring and management of chronic conditions

Frequently Asked Questions About IgA Blood Testing and Deficiency

What is the main purpose of an IgA blood test?
The IgA blood test measures immunoglobulin A levels in blood to help diagnose immunodeficiency, autoimmune disorders, or certain types of cancer. It’s most commonly used to detect IgA deficiency, which increases susceptibility to infections.

How common is selective IgA deficiency?
Selective IgA deficiency represents the most common primary immunodeficiency, affecting approximately 1 in 600 people in the general population. Prevalence varies by ethnic background, with higher rates in individuals of European descent.

Can IgA deficiency be cured?
Currently, there is no cure for primary IgA deficiency. Treatment focuses on managing symptoms, preventing infections, and addressing associated conditions. Some children with transient deficiency may outgrow the condition, and drug-induced deficiency may resolve with medication discontinuation.

Is IgA deficiency the same as having no immune system?
No, IgA deficiency involves only one component of the immune system. Other immune functions typically remain intact, unlike in severe combined immunodeficiency where multiple immune system arms are affected.

What is the connection between IgA deficiency and celiac disease?
Individuals with IgA deficiency have 10-15 times higher risk of developing celiac disease. Diagnosis requires IgG-based testing since standard celiac tests measure IgA antibodies and may yield false negatives in IgA-deficient patients.

Can you develop IgA deficiency later in life?
While often identified in childhood, IgA deficiency can be diagnosed at any age. Secondary forms may develop due to medications, infections, or other medical conditions, though the mechanism differs from primary genetic deficiency.

Are there dietary recommendations for people with IgA deficiency?
No specific diet exists for IgA deficiency itself, but individuals should follow balanced nutrition to support immune function. Those with associated celiac disease require strict gluten-free diets, and some may benefit from probiotic supplementation.


Disclaimer: This article provides educational information only and does not constitute medical advice. Always consult healthcare professionals for personalized medical guidance. The immune deficiency risk calculator offers estimates based on statistical probabilities, not definitive diagnoses.


Immunity Support Supplements:

  • Quality probiotic formulations specifically designed for immune health
  • Vitamin D supplements with clinical evidence for immune function support
  • Zinc supplements proven to reduce infection duration and severity

Home Health Monitoring Tools:

  • Digital thermometers for accurate fever monitoring
  • Personal pulse oximeters to track respiratory status
  • Home blood pressure monitors for comprehensive health tracking

Infection Prevention Products:

  • Medical-grade hand sanitizers and disinfectant solutions
  • High-quality face masks for infection protection in public spaces
  • UV sanitizing devices for personal items and frequently touched surfaces

Specialized Nutritional Products:

  • Gluten-free food delivery services for those with celiac disease
  • Medical nutrition shakes for individuals with malabsorption issues
  • Vitamin-enriched functional foods designed for immune support

Health and Wellness Resources:

  • Subscription services for immune-supporting supplements
  • Telemedicine platform memberships for convenient specialist access
  • Medical alert jewelry specifically designed for immunodeficiency conditions

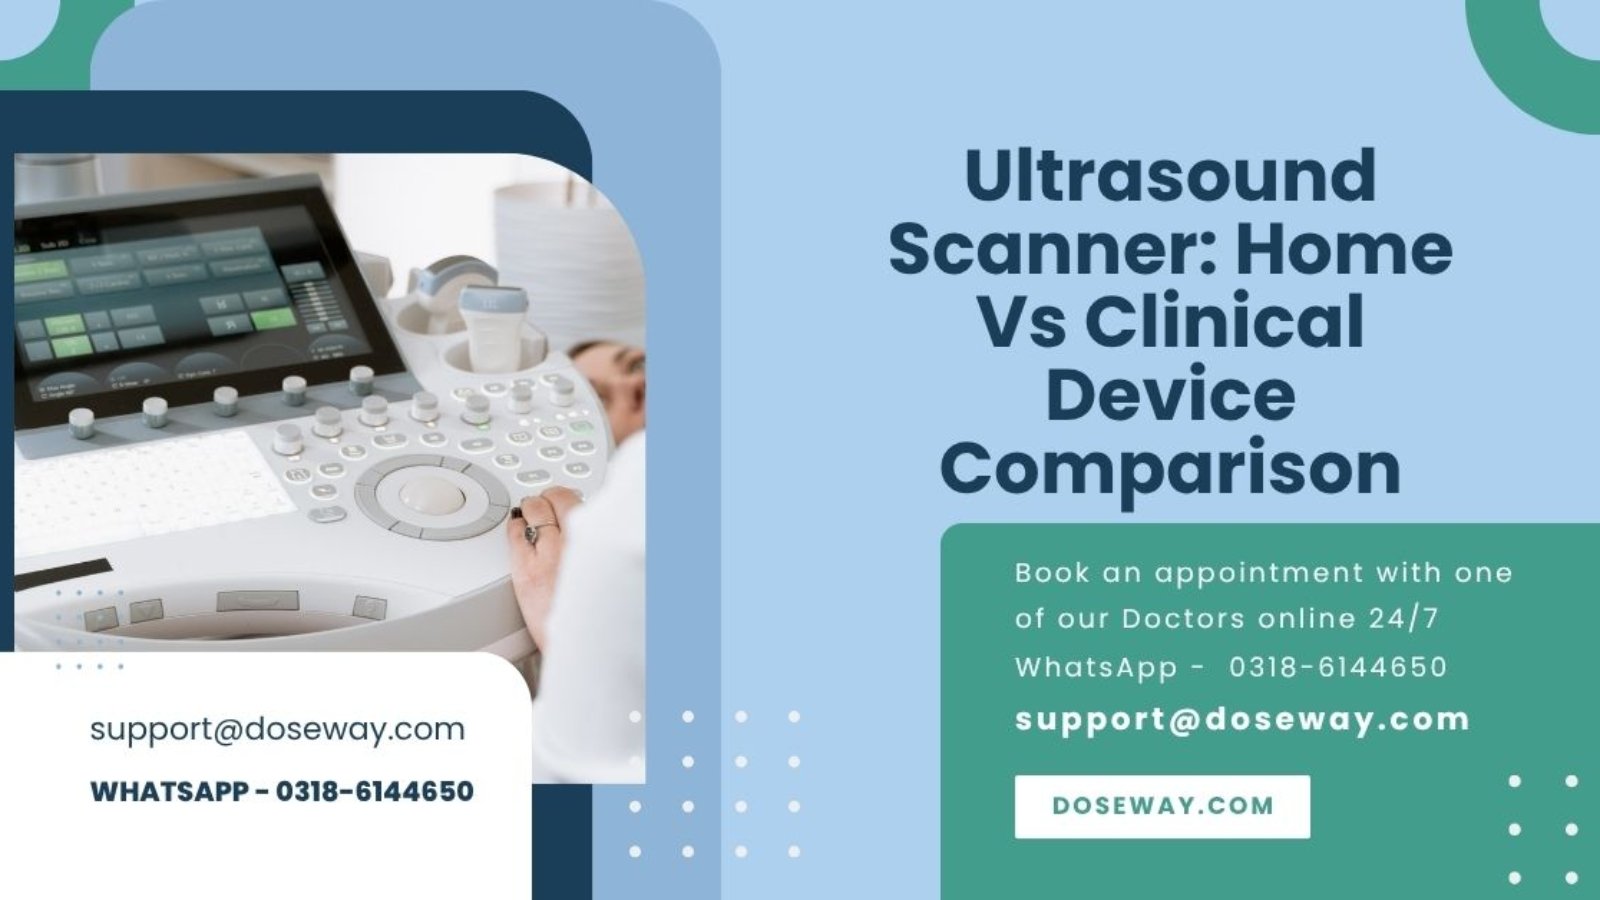
Ultrasound-Scanner-Home-Vs-Clinical-Device-Comparison

Ultrasound Scanner: Home Vs Clinical Device Comparison

Ultrasound technology has revolutionized medical imaging, but the emergence of home ultrasound devices has created new questions about safety, efficacy, and appropriate usage. This comprehensive guide examines the critical differences between professional clinical ultrasound systems and consumer home devices, helping you understand when each option is appropriate and how to properly prepare for ultrasound examinations regardless of setting.

What You’ll Learn From This Guide

📋 Understanding ultrasound technology fundamentals
🏠 Home ultrasound device capabilities and limitations
🏥 Clinical ultrasound system features and advantages
⚖️ Direct comparison: home vs clinical ultrasound devices
💰 Cost analysis and investment considerations
🛒 Recommended ultrasound devices for different needs
📊 Preparation checklist for ultrasound procedures

Ultrasound Scanning Preparation Checklist

Ultrasound Scanning Preparation Checklist

Complete this checklist to ensure you’re properly prepared for your ultrasound procedure

1
Demographics
2
Medical History
3
Ultrasound Type
4
Results

Patient Demographics

Disclaimer: This tool is for informational purposes only and does not constitute medical advice. Always consult with a qualified healthcare professional for medical guidance and preparation instructions specific to your situation.

Try More Free Tools:

Free-Ultrasound-Scanner-Home-Vs-Clinical-Device-Comparison

What is Ultrasound Technology and How Does Medical Imaging Work?

Ultrasound imaging, also known as sonography, utilizes high-frequency sound waves to create real-time visualizations of internal body structures. These sound waves, typically ranging from 2 to 18 megahertz, travel through body tissues and reflect back to the transducer, creating detailed images without ionizing radiation exposure. The fundamental principle involves piezoelectric crystals within the transducer that convert electrical energy into sound waves and vice versa, enabling both transmission and reception of ultrasonic signals.

Medical ultrasound serves multiple diagnostic purposes across various specialties. Obstetricians use it to monitor fetal development, cardiologists employ echocardiography to assess heart function, and emergency physicians utilize focused assessment with sonography for trauma (FAST) exams. The technology's real-time imaging capability makes it invaluable for guiding procedures like biopsies, injections, and fluid drainage. Understanding these basic principles helps contextualize the differences between home and clinical ultrasound devices.

Key ultrasound imaging modalities include:

  • B-mode (brightness mode): Standard two-dimensional grayscale imaging
  • Doppler ultrasound: Blood flow assessment and vascular imaging
  • M-mode (motion mode): Evaluation of moving structures like heart valves
  • 3D/4D ultrasound: Three-dimensional and real-time 3D imaging
  • Elastography: Tissue stiffness measurement for fibrosis assessment

How Do Home Ultrasound Devices Differ from Clinical Ultrasound Systems?

Home ultrasound devices represent a simplified version of clinical systems, designed for consumer use with significant limitations in capability and image quality. These consumer-grade devices typically operate at lower frequencies with less sophisticated transducers, resulting in reduced image resolution and diagnostic capability. Most home ultrasound units are classified as wellness devices rather than medical diagnostic tools, meaning they haven't undergone the rigorous testing and validation required for clinical diagnosis.

The regulatory distinction represents a fundamental difference between these device categories. Clinical ultrasound systems receive FDA clearance as Class II medical devices requiring premarket notification [510(k)] or premarket approval (PMA). Home devices often qualify as Class I exempt devices or general wellness products, which don't require the same level of clinical evidence for safety and effectiveness. This regulatory gap translates to significant differences in performance, reliability, and intended use between home and clinical ultrasound platforms.

Critical differences between home and clinical ultrasound devices:

FeatureHome Ultrasound DevicesClinical Ultrasound Systems
Image ResolutionLimited (typically <128 elements)High (256-512 elements)
Frequency RangeNarrow (usually 1-5 MHz)Broad (1-18 MHz)
Transducer TypesSingle generic transducerMultiple specialized transducers
Doppler CapabilityRarely availableStandard feature
Regulatory StatusWellness device/Class IMedical device/Class II
Image StorageLimited or noneDICOM compatible
Price Range$100-$2,000$10,000-$300,000+

What Are the Technical Specifications of Clinical Ultrasound Machines?

Clinical ultrasound systems feature advanced technological components that enable comprehensive diagnostic imaging across medical specialties. These high-performance machines incorporate sophisticated beamforming technology, multiple transducer options, advanced signal processing algorithms, and comprehensive measurement packages. The image quality in clinical systems stems from hundreds of transducer elements working in concert with powerful computing platforms that process returning echoes into diagnostically useful images.

Modern clinical ultrasound platforms offer specialized imaging modes that significantly enhance diagnostic capability. Harmonic imaging reduces artifact and improves contrast resolution, while compound scanning minimizes speckle and enhances tissue boundary definition. Extended field of view imaging allows visualization of structures larger than the transducer footprint, and contrast-enhanced ultrasound utilizes microbubble agents to evaluate perfusion and characterize lesions. These advanced features collectively enable clinicians to make accurate diagnoses that directly impact patient management decisions.

Essential technical components of clinical ultrasound systems:

  • Multi-frequency transducers (linear, curvilinear, phased array, endocavitary)
  • Advanced digital beamformers with dynamic focusing
  • High-density matrix array transducers (2,000+ elements)
  • Real-time tissue elastography capability
  • Automated image optimization technologies
  • Quantification packages for cardiac, vascular, and obstetric applications
  • DICOM compatibility for PACS integration

What Are the Capabilities and Limitations of Home Ultrasound Devices?

Home ultrasound devices provide limited imaging capability primarily suited for basic visualization rather than diagnostic purposes. These consumer-grade devices typically connect to smartphones or tablets via USB or Bluetooth, using simplified applications that prioritize user experience over diagnostic accuracy. The most capable home ultrasound devices can visualize superficial structures like muscles, tendons, and large blood vessels, but lack the resolution and feature sets necessary for comprehensive medical assessment.

The primary limitations of home ultrasound devices stem from their simplified design and cost constraints. Most consumer devices utilize single-element or low-element count transducers that produce inferior image quality compared to clinical systems. They typically lack Doppler capability, making vascular assessment impossible, and have limited penetration depth, restricting visualization to superficial structures. Additionally, home devices rarely include calibration, quality assurance features, or service contracts, potentially leading to performance degradation over time.

Common applications and limitations of home ultrasound devices:

Potential applications:

  • Basic muscle and tendon visualization
  • Limited fetal heartbeat detection (after 12 weeks)
  • Superficial blood vessel identification
  • Educational demonstrations of ultrasound principles
  • Limited monitoring of known superficial conditions

Significant limitations:

  • Inadequate for diagnostic decision-making
  • Limited penetration depth (typically <6cm)
  • No spectral or color Doppler capability
  • Inability to detect deep pathology
  • Lack of measurement and quantification tools
  • No regulatory oversight for diagnostic accuracy

When Are Home Ultrasound Devices Appropriate to Use?

Home ultrasound devices may serve limited purposes for wellness monitoring, educational demonstrations, and basic visualization of superficial structures under specific circumstances. Consumers might consider these devices for tracking known musculoskeletal conditions between clinical visits, observing superficial blood vessels for educational purposes, or basic demonstration of ultrasound principles. Some pregnancy-focused home devices claim to detect fetal heartbeats, though medical professionals question their reliability and potential for creating false reassurance.

The appropriate use of home ultrasound devices requires understanding their significant limitations. These devices should never replace professional medical evaluation, diagnosis, or monitoring of potentially serious conditions. Users must recognize that normal-appearing images from home devices don't exclude significant pathology, and abnormal findings require confirmation through proper clinical evaluation. Additionally, home ultrasound use should follow manufacturer guidelines regarding application duration, frequency settings, and appropriate body areas to prevent potential tissue damage from improper use.

Situations where home ultrasound might be considered:

  • Educational demonstrations of basic ultrasound principles
  • Superficial visualization of known musculoskeletal structures
  • Limited monitoring of previously diagnosed superficial conditions
  • Basic visualization for personal interest (with understanding of limitations)

Situations requiring clinical ultrasound instead:

  • Any diagnostic purpose or symptom evaluation
  • Pregnancy monitoring and fetal assessment
  • Cardiac, abdominal, or deep tissue evaluation
  • Vascular assessment including blood flow measurement
  • Evaluation of new symptoms or changing conditions

What Safety Considerations Apply to Home Ultrasound Use?

Home ultrasound devices present potential safety concerns including thermal effects, mechanical bioeffects, and misinterpretation risk that users must carefully consider. The American Institute of Ultrasound in Medicine (AIUM) states that diagnostic ultrasound has an excellent safety record when used appropriately by trained operators, but cautions that potential bioeffects exist particularly with elevated acoustic output. Home users lack the training to properly adjust settings to minimize risks, potentially exposing tissues to unnecessary energy deposition.

The mechanical effects of ultrasound include cavitation, where gas bubbles in tissues oscillate and potentially collapse, generating localized heat and shock waves. Thermal effects occur when tissue absorbs ultrasound energy, potentially raising temperatures particularly in bone near soft tissue interfaces. While clinical operators receive training to monitor thermal and mechanical indices displayed on ultrasound systems, home devices typically lack these safety indicators and user education about their significance.

Essential safety guidelines for home ultrasound use:

  • Limit exposure time according to manufacturer recommendations
  • Avoid use over sensitive areas (eyes, pregnant uterus without medical guidance)
  • Never use on open wounds or infected tissues
  • Discontinue use if discomfort or pain occurs
  • Understand that absence of safety indices requires conservative usage
  • Recognize that home devices may not have undergone rigorous safety testing
  • Consult healthcare providers before using for medical conditions

How Much Do Ultrasound Devices Cost for Home vs Clinical Use?

Ultrasound device costs vary dramatically between consumer home devices ($100-$2,000) and clinical systems ($10,000-$300,000+), reflecting vast differences in capability and regulatory status. Home ultrasound devices represent relatively minimal investments focused on basic visualization, while clinical systems constitute significant capital equipment purchases with ongoing service and maintenance costs. The price differential stems from differences in transducer technology, computing power, software capabilities, and regulatory compliance requirements.

Clinical ultrasound systems involve substantial additional costs beyond the initial purchase price. Service contracts typically run 8-12% of system cost annually, transducer replacements cost $3,000-$15,000 each, and software upgrades represent ongoing expenses. Additionally, clinical systems require proper space, electrical requirements, and potentially structural modifications for installation. These factors make clinical ultrasound a significant investment primarily justified by diagnostic capability and revenue generation through clinical services.

Cost comparison between home and clinical ultrasound options:

Home ultrasound devices:

  • Basic consumer models: $100-$500
  • Mid-range home devices: $500-$1,500
  • High-end consumer systems: $1,500-$2,500
  • Smartphone-connected probes: $200-$1,000

Clinical ultrasound systems:

  • Portable/point-of-care systems: $10,000-$50,000
  • Mid-range cart-based systems: $50,000-$120,000
  • High-end premium systems: $120,000-$250,000
  • Specialized systems (echo, women's health): $80,000-$300,000+

What Are the Best Ultrasound Device Options for Different Needs?

Selecting appropriate ultrasound equipment requires matching device capabilities to specific use cases, ranging from basic educational purposes to comprehensive diagnostic imaging. For clinical applications, major manufacturers including GE Healthcare, Philips, Siemens Healthineers, Canon Medical Systems, and Samsung Medison offer systems with specialized features for different medical specialties. For home and personal use, companies like Butterfly Network, Clarius Mobile Health, and EchoNous provide handheld devices with varying capabilities and price points.

Clinical ultrasound selection depends heavily on specialty requirements. Obstetrics/gynecology practices benefit from systems with high-frequency transducers, 3D/4D capability, and specialized measurement packages. Emergency medicine and critical care require rugged portable systems with multiple transducer options and rapid boot-up times. Musculoskeletal practices need high-resolution linear transducers with extensive measurement capabilities, while vascular specialists require sophisticated Doppler and hemodynamic calculation packages.

Recommended ultrasound devices by use case:

Clinical applications:

  • General imaging/radiology: GE Logiq E10, Philips EPIQ Elite
  • Cardiology: Philips Epiq CVx, Siemens Acuson Sequoia
  • Obstetrics/women's health: GE Voluson E10, Samsung WS80A
  • Emergency medicine/point-of-care: Sonosite PX, Fujifilm Sonosite Edge II
  • Veterinary medicine: Esaote MyLab, Mindray M9

Home/educational applications:

  • Basic educational: Butterfly iQ+ (whole-body single probe)
  • Musculoskeletal interest: Clarius C15 (high-frequency linear)
  • Abdominal/pregnancy interest: Clarius C7 (curvilinear)
  • Veterinary home use: Ekuore Pro VET

How Does Ultrasound Preparation Differ Between Home and Clinical Settings?

Proper ultrasound preparation varies significantly between home and clinical environments, with clinical settings implementing comprehensive protocols to ensure diagnostic accuracy and patient safety. Clinical ultrasound preparation involves multiple components including patient instructions, equipment preparation, environmental considerations, and documentation requirements. Proper preparation directly impacts image quality, measurement accuracy, and ultimately diagnostic confidence, making systematic protocols essential in clinical practice.

Patient preparation represents a critical difference between home and clinical ultrasound use. Clinical settings provide specific instructions regarding fasting, hydration, clothing, and medication management based on the examination type. Abdominal ultrasound typically requires 6-8 hours fasting to reduce bowel gas, while pelvic ultrasound often requires a full bladder to create an acoustic window. These standardized preparations ensure optimal imaging conditions that home users typically cannot replicate, contributing to the diagnostic superiority of clinical ultrasound examinations.

Essential clinical ultrasound preparation components:

  • Patient history review and procedure explanation
  • Appropriate fasting/hydration protocols based on exam type
  • Proper patient positioning and transducer selection
  • Acoustic coupling gel application
  • Equipment settings optimization for specific examination
  • Safety checks including thermal index monitoring
  • Documentation and image labeling protocols

What is the Ultrasound Preparation Checklist Calculator?

Our Ultrasound Preparation Checklist Calculator is a comprehensive digital tool that helps patients and healthcare providers systematically prepare for ultrasound examinations across various clinical scenarios. This interactive calculator incorporates evidence-based preparation guidelines for different ultrasound types, patient factors, and clinical situations. By inputting specific examination details and patient characteristics, users receive personalized preparation instructions to optimize examination quality and diagnostic yield.

The calculator utilizes algorithmic processing of multiple variables to generate customized preparation protocols. It considers factors including ultrasound type (abdominal, pelvic, vascular, etc.), patient demographics, medical history, and specific clinical questions to provide tailored recommendations. The tool also includes educational components explaining the rationale behind various preparation steps, helping patients understand and adhere to instructions that might otherwise seem arbitrary or inconvenient.

Key features of the Ultrasound Preparation Checklist Calculator:

  • Personalized preparation protocols based on examination type
  • Integration of patient-specific factors and medical history
  • Timing recommendations for fasting, hydration, and medication
  • Clothing and personal item guidance
  • Documentation checklist for previous imaging and reports
  • Real-time preparation score calculation
  • Printable preparation instructions and reminders

How to Use the Ultrasound Preparation Checklist Calculator Effectively?

Using the Ultrasound Preparation Checklist Calculator involves a simple four-step process that gathers essential information to generate personalized preparation guidance. The interface guides users through demographic information, medical history, specific ultrasound examination details, and preparation verification to create a comprehensive preparation plan. The calculator's user-friendly design ensures accessibility for patients while maintaining clinical relevance for healthcare providers.

The calculator begins with basic demographic information including age, gender, height, and weight, which influence preparation protocols and examination approach. The medical history section identifies factors that might modify standard preparation, such as diabetes requiring adjustment of fasting protocols or mobility issues necessitating positioning modifications. The ultrasound-specific section tailors preparation based on examination type, while the final component generates a preparation score and verifies understanding of instructions.

Step-by-step calculator usage guide:

  1. Input demographic information and medical history
  2. Select ultrasound examination type and clinical indication
  3. Review generated preparation protocol with timing recommendations
  4. Verify understanding and generate printable preparation plan
  5. Utilize preparation score to identify areas needing attention
  6. Share results with healthcare providers as needed

What Do the Ultrasound Preparation Assessment Results Mean?

The Ultrasound Preparation Assessment Results provide a quantitative evaluation of preparation adequacy, helping identify potential factors that might compromise examination quality. The preparation score ranges from 0-100%, with higher scores indicating better alignment with evidence-based preparation protocols. The results include specific feedback regarding preparation components, highlighting areas of excellence and identifying aspects requiring improvement before the scheduled examination.

The assessment categorizes preparation quality into three tiers: excellent preparation (80-100%), good preparation with minor modifications needed (60-79%), and inadequate preparation requiring significant changes (below 60%). Each category includes specific recommendations to address deficiencies, with excellent preparation indicating likely optimal imaging conditions, while lower scores suggest potential limitations in diagnostic capability that might necessitate rescheduling or modified interpretation.

Interpretation of preparation assessment results:

Excellent preparation (80-100%):

  • All major preparation components appropriately addressed
  • Minimal anticipated limitations to imaging quality
  • High likelihood of diagnostic examination
  • Continue with current preparation plan

Good preparation (60-79%):

  • Most preparation components addressed
  • Some modifications could improve imaging
  • Diagnostic examination likely with minor limitations
  • Implement specific recommendations provided

Inadequate preparation (below 60%):

  • Significant preparation deficiencies identified
  • Potential for substantially limited diagnostic capability
  • Consider rescheduling with proper preparation
  • Implement comprehensive preparation modifications

What Are the Professional Recommendations for Ultrasound Preparation?

Evidence-based ultrasound preparation recommendations vary by examination type but share common principles aimed at optimizing acoustic access and image quality. These protocols have developed through clinical experience and research identifying factors that significantly impact examination diagnostic yield. Following specialty-specific preparation guidelines represents a crucial component of quality ultrasound practice, directly influencing diagnostic accuracy and patient outcomes.

Standard preparation protocols address both patient-related and technical factors. Patient components include dietary modifications, hydration management, medication timing, and clothing selection. Technical aspects encompass equipment selection, transducer frequency choice, appropriate settings optimization, and documentation standards. The combination of proper patient preparation and technical optimization creates ideal conditions for high-quality ultrasound imaging across various clinical scenarios.

Specialty-specific ultrasound preparation guidelines:

Abdominal ultrasound preparation:

  • 6-8 hour fasting to reduce bowel gas
  • No smoking or gum chewing before examination
  • Continue essential medications with small sips of water
  • Wear comfortable, loose-fitting clothing

Pelvic ultrasound preparation:

  • 32 ounces water consumption 1 hour before examination
  • Avoid emptying bladder before examination completion
  • For transvaginal ultrasound: empty bladder immediately before procedure
  • Continue regular medications unless specifically instructed

Renal ultrasound preparation:

  • Similar to abdominal ultrasound preparation
  • Fasting for 6-8 hours before examination
  • Adequate hydration in days preceding examination
  • Specific instructions regarding diuretic medications

Vascular ultrasound preparation:

  • No specific fasting requirements for most examinations
  • Avoid nicotine for 2 hours before vascular studies
  • Wear loose-fitting clothing allowing access to examination areas
  • Continue regular medications unless specifically instructed

How Does Proper Ultrasound Preparation Impact Examination Quality?

Proper ultrasound preparation directly influences image quality, measurement accuracy, and diagnostic confidence across all ultrasound examination types. Inadequate preparation represents a common source of limited examinations, potentially necessitating repeat studies, additional imaging, or diagnostic uncertainty. Understanding the relationship between specific preparation components and image quality helps both patients and providers prioritize adherence to preparation protocols.

The mechanical effects of preparation on ultrasound image quality stem from acoustic impedance differences between tissues. Gas-containing structures like bowel create near-total reflection of ultrasound beams, preventing visualization of deeper structures. Fluid-filled structures create excellent acoustic windows, enabling visualization of adjacent organs. Preparation protocols strategically manipulate these acoustic properties through dietary modifications, hydration management, and timing to create optimal imaging conditions.

Impact of specific preparation components on examination quality:

Fasting for abdominal ultrasound:

  • Reduces bowel gas from swallowing air
  • Decreases gallbladder contraction for improved evaluation
  • Minimizes food content in stomach and duodenum
  • Allows comprehensive evaluation of pancreas and retroperitoneum

Full bladder for pelvic ultrasound:

  • Creates acoustic window for uterine and adnexal evaluation
  • Displaces gas-filled bowel from pelvis
  • Allows assessment of bladder wall and content
  • Facilitates comparison of uterine position and orientation

Hydration for renal ultrasound:

  • Improves hydronephrosis detection sensitivity
  • Enhances renal cortex medullary differentiation
  • Facilitates Doppler evaluation of renal vasculature
  • Optimizes urinary bladder assessment

Ultrasound technology continues evolving with artificial intelligence integration, miniaturization, and advanced applications transforming both clinical and potential home use scenarios. AI-based applications automate measurements, guide image acquisition, and assist with interpretation, potentially reducing operator dependence and expanding ultrasound accessibility. Miniaturization progresses toward smartphone-connected devices with improving capabilities, though significant gaps remain between these devices and clinical systems.

Advanced ultrasound applications including elastography, contrast-enhanced ultrasound, and fusion imaging expand diagnostic capability beyond traditional anatomical assessment. Elastography quantitatively evaluates tissue stiffness for fibrosis assessment in liver disease, thyroid nodules, and prostate cancer. Contrast-enhanced ultrasound utilizes microbubble agents to evaluate perfusion in organs and lesions, while fusion imaging combines real-time ultrasound with pre-acquired CT or MRI datasets for procedural guidance.

Emerging ultrasound technology developments:

Artificial intelligence applications:

  • Automated image optimization and measurement
  • Anatomy recognition and scan guidance
  • Pathology detection and characterization
  • Workflow integration and documentation

Portable and connected devices:

  • Smartphone-connected ultrasound probes
  • Wireless transducer technology
  • Cloud-based image storage and sharing
  • Tele-ultrasound applications

Advanced imaging capabilities:

  • Super-resolution microvascular imaging
  • Quantitative tissue characterization
  • 3D printing integration from ultrasound data
  • Molecular imaging with targeted contrast agents

What Training and Education is Required for Ultrasound Operation?

Proper ultrasound operation requires comprehensive education combining theoretical knowledge, practical training, and ongoing experience to ensure patient safety and diagnostic accuracy. Clinical ultrasound operators typically complete formal education programs including classroom instruction, laboratory practice, and clinical internships covering ultrasound physics, instrumentation, anatomy, pathology, and patient care. Certification through organizations like the American Registry for Diagnostic Medical Sonography (ARDMS) validates competence through examination and experience requirements.

The training gap between clinical sonographers and home users represents a significant safety consideration. Clinical operators understand acoustic output parameters, safety indices, and bioeffects, enabling appropriate adjustment of settings to minimize risk while obtaining diagnostic information. Home users typically lack this knowledge, potentially creating safety risks through inappropriate usage. Additionally, image interpretation requires substantial training and experience to recognize artifacts, normal variants, and pathological findings accurately.

Essential components of ultrasound education:

Theoretical knowledge:

  • Ultrasound physics and instrumentation
  • Acoustics and bioeffects
  • Cross-sectional anatomy and pathology
  • Image optimization principles
  • Safety guidelines and protocols

Practical skills:

  • Transducer manipulation and scanning techniques
  • Image optimization and measurement
  • Protocol implementation and modification
  • Patient positioning and communication
  • Emergency response and infection control

Clinical competence:

  • Pathology recognition and differential diagnosis
  • Examination appropriate to clinical question
  • Integration with other clinical information
  • Quality assurance and improvement
  • Professional communication and reporting

Frequently Asked Questions About Ultrasound Devices

What is the difference between a home ultrasound device and a clinical ultrasound machine?
Home ultrasound devices are consumer-grade products designed for basic visualization and educational purposes, while clinical ultrasound machines are medical-grade systems with regulatory clearance for diagnostic imaging. The differences include image quality, transducer options, Doppler capability, measurement tools, and regulatory status. Clinical systems undergo rigorous testing for diagnostic accuracy and safety, while home devices have limited capabilities and aren't intended for medical decision-making.

Are home ultrasound devices safe to use during pregnancy?
Most medical professionals discourage routine home ultrasound use during pregnancy due to potential risks and limitations. While diagnostic ultrasound has an excellent safety record in clinical settings, home devices lack safety indices and proper training for operation. Additionally, home devices may provide false reassurance if users misinterpret images or miss significant findings. Pregnancy monitoring should occur under appropriate medical supervision with proper equipment and interpretation.

Can home ultrasound devices detect serious medical conditions?
Home ultrasound devices have significant limitations in detecting serious medical conditions due to restricted image quality, limited penetration depth, and operator inexperience. These devices might visualize obvious superficial abnormalities but cannot reliably exclude pathology or make diagnostic determinations. Any concerning symptoms or findings should prompt proper medical evaluation with clinical-grade equipment and professional interpretation.

How much does a good home ultrasound device cost?
Quality home ultrasound devices range from approximately $500 to $2,500, with higher-priced models typically offering better image quality and more features. However, even premium home devices cannot match the capabilities of clinical systems costing $10,000 or more. Consumers should carefully consider their intended use and recognize the significant limitations of home ultrasound before investing in these devices.

What should I look for when choosing an ultrasound device for home use?
When selecting a home ultrasound device, consider image quality, compatibility with your devices, transducer frequency options, software features, and manufacturer support. Look for devices with adequate resolution for your intended use, appropriate connectivity for your smartphone or tablet, and frequency ranges suitable for the structures you want to visualize. However, remember that even the best home devices have significant limitations compared to clinical systems.

Do I need special training to use a home ultrasound device?
While home ultrasound devices designed for consumers have simplified interfaces, proper interpretation of ultrasound images requires substantial training and experience. Without appropriate education, users may misinterpret normal findings as abnormal or miss significant pathology. If using a home device, thoroughly review the manufacturer's instructions, understand the device limitations, and never make medical decisions based on home ultrasound findings.

Can I use a home ultrasound device instead of visiting my doctor?
Home ultrasound devices should never replace proper medical evaluation by qualified healthcare providers. These devices have limited capabilities and cannot exclude significant pathology or provide diagnostic information. Any health concerns or symptoms warrant appropriate medical assessment with proper equipment and professional interpretation. Home devices may supplement but should not replace clinical care.

Disclaimer

This article provides educational information only and does not constitute medical advice. Ultrasound equipment should be used under appropriate professional guidance, and any health concerns should be addressed with qualified healthcare providers.

Nuclear-Magnetic-Resonance-Advanced-Lipid-Testing

Nuclear Magnetic Resonance: Advanced Lipid Testing

Nuclear Magnetic Resonance (NMR) spectroscopy represents the gold standard in advanced lipid testing, providing unprecedented insights into cardiovascular disease risk through detailed analysis of lipoprotein particles. This cutting-edge technology moves beyond traditional cholesterol tests to reveal the true complexity of your lipid profile, identifying subtle patterns and particle characteristics that conventional testing misses. Our comprehensive guide explores this revolutionary diagnostic approach while providing practical tools for understanding your cardiovascular health.

What You’ll Learn From This Guide

• The science behind NMR lipoprotein testing and why it matters
• How to interpret complex lipid particle data for accurate risk assessment
• Practical strategies for optimizing your lipid profile based on NMR results
• The relationship between lipoprotein patterns and cardiovascular disease
• How to use our free NMR Lipoprofile calculator for personalized insights

NMR Lipoprofile Result Interpreter | Doseway

NMR Lipoprofile Result Interpreter

Comprehensive analysis of your NMR Lipoprofile test results

1
Demographics
2
Medical History
3
Lipid Parameters
4
Results

Demographic Information

Please provide your basic information for personalized assessment.

cm
ft/in
kg
lbs

Disclaimer: This tool provides educational information only and is not a substitute for professional medical advice. Consult your healthcare provider for personalized medical guidance. Results are based on statistical models and may not reflect individual risk accurately.

Try More Free Tools:

Free-Nuclear-Magnetic-Resonance-Advanced-Lipid-Testing

What is NMR Lipoprotein Testing and How Does It Work?

Nuclear Magnetic Resonance spectroscopy represents a revolutionary approach to lipid analysis that fundamentally differs from traditional cholesterol testing methods. Unlike conventional lipid panels that simply measure cholesterol content within lipoproteins, NMR technology directly quantifies the number and size of lipoprotein particles circulating in your bloodstream. This distinction is crucial because cardiovascular risk correlates more strongly with the number of atherogenic particles than with the cholesterol they carry.

The underlying principle of NMR lipoprotein testing relies on the unique magnetic properties of lipid molecules. When exposed to a strong magnetic field, the hydrogen atoms in lipoprotein particles resonate at characteristic frequencies that can be measured and analyzed. Each lipoprotein subclass produces a distinct NMR signal based on its size and composition, allowing the instrument to differentiate between various particle types and generate a detailed profile of your lipoprotein landscape.

This advanced methodology provides several critical advantages over traditional testing. NMR can directly measure LDL particle number (LDL-P), which represents a more accurate predictor of cardiovascular risk than LDL cholesterol (LDL-C). The technology also identifies patterns of particle size distribution, particularly distinguishing between large, buoyant LDL particles (Pattern A) and small, dense LDL particles (Pattern B), with the latter being significantly more atherogenic.

How Does NMR Technology Differ From Standard Lipid Panels?

Traditional lipid panels and NMR lipoprotein testing approach cardiovascular risk assessment from fundamentally different perspectives. Conventional lipid panels utilize chemical precipitation and enzymatic methods to quantify the cholesterol content within various lipoprotein fractions. While these tests provide valuable information about HDL cholesterol, LDL cholesterol, and triglycerides, they miss critical nuances about lipoprotein particle characteristics that significantly impact cardiovascular risk.

NMR spectroscopy, in contrast, measures the actual number and size of lipoprotein particles through their inherent magnetic properties. This approach reveals several crucial parameters that standard testing cannot detect:

Particle Concentration Metrics

  • LDL particle number (LDL-P): Total count of all LDL particles
  • HDL particle number (HDL-P): Concentration of HDL particles
  • Small LDL particle count: Specifically quantifies the most dangerous LDL subtype

Particle Size Distribution

  • LDL particle size: Average diameter of LDL particles
  • HDL particle size: Average diameter of HDL particles
  • Pattern classification: Categorizes LDL distribution as Pattern A (large), Pattern B (small), or intermediate

Advanced Risk Markers

  • Lipoprotein insulin resistance (LP-IR) score: Emerging marker of insulin resistance
  • Remnant lipoprotein particles: Associated with residual cardiovascular risk

The clinical significance of these differences becomes apparent when considering that two individuals with identical LDL cholesterol levels can have dramatically different LDL particle numbers and cardiovascular risk profiles. NMR testing identifies this discordance, allowing for more accurate risk stratification and targeted therapeutic interventions.

Why is NMR Testing Considered Superior for Cardiovascular Risk Assessment?

Multiple large-scale epidemiological studies and clinical trials have established the superior predictive value of NMR lipoprotein testing compared to conventional lipid parameters. The fundamental reason for this advantage lies in the pathophysiological mechanisms of atherosclerosis, which is primarily driven by the number of atherogenic particles that penetrate the arterial wall rather than the cholesterol content these particles carry.

Scientific Evidence Supporting NMR Superiority

  • The Multi-Ethnic Study of Atherosclerosis demonstrated that LDL particle number predicts cardiovascular events more accurately than LDL cholesterol
  • The Framingham Heart Study found NMR-measured lipoprotein parameters significantly improved risk prediction beyond standard lipids
  • Recent meta-analyses confirm small LDL particles confer approximately three-fold greater cardiovascular risk than large LDL particles

Clinical Applications Where NMR Excels

  • Identifying residual risk in patients with apparently “normal” LDL cholesterol
  • Guiding therapy intensification in statin-treated patients
  • Detecting atherogenic dyslipidemia in metabolic syndrome and diabetes
  • Monitoring response to lifestyle interventions and specific medications

Practical Advantages in Patient Management

  • Single test provides comprehensive lipoprotein profiling
  • No requirement for fasting in many clinical scenarios
  • High reproducibility and standardization across laboratories
  • Ability to track nuanced changes in lipoprotein metabolism

The growing body of evidence supporting NMR testing has led major professional societies, including the American Diabetes Association and American College of Cardiology, to recognize advanced lipoprotein testing as a valuable tool for risk refinement in selected patient populations.

What Are the Key Biomarkers Measured in an NMR Lipoprofile?

Understanding the specific biomarkers provided by NMR lipoprotein testing is essential for interpreting results and making informed clinical decisions. Each parameter offers unique insights into different aspects of lipoprotein metabolism and cardiovascular risk.

LDL Particle Number (LDL-P)
LDL-P represents the total concentration of LDL particles in the blood, measured in nanomoles per liter (nmol/L). This parameter directly quantifies the number of potentially atherogenic particles, making it a more accurate predictor of cardiovascular risk than LDL cholesterol. Optimal levels typically fall below 1,000 nmol/L, while values exceeding 1,600 nmol/L indicate very high risk.

Small LDL Particle Number
This specific measurement quantifies the concentration of small, dense LDL particles, which are particularly atherogenic due to their enhanced ability to penetrate the arterial wall, prolonged circulation time, and increased susceptibility to oxidation. Elevated small LDL-P (>600 nmol/L) significantly increases cardiovascular risk independent of other lipid parameters.

LDL Particle Size
LDL particle size reflects the average diameter of LDL particles, typically reported in nanometers (nm). Larger, buoyant particles (Pattern A, >20.6 nm) are associated with lower risk, while smaller, dense particles (Pattern B, <20.5 nm) confer significantly higher cardiovascular risk. The intermediate pattern falls between these values.

HDL Particle Number (HDL-P)
HDL-P measures the total concentration of HDL particles, providing information beyond HDL cholesterol levels. Higher HDL particle numbers are generally associated with improved cardiovascular protection, with optimal levels typically exceeding 35 μmol/L in men and 40 μmol/L in women.

Lipoprotein Insulin Resistance (LP-IR) Score
The LP-IR score is a composite marker derived from six NMR-measured lipoprotein parameters that reflects insulin resistance. This score ranges from 0-100, with higher values indicating greater insulin resistance. The LP-IR score can identify insulin resistance earlier than traditional markers and track improvements with interventions.

How to Interpret Your NMR Lipoprofile Results?

Interpreting NMR lipoprofile results requires understanding both individual parameters and their integrated patterns. The following framework provides a systematic approach to result interpretation.

Optimal Ranges for Key NMR Parameters

ParameterOptimal RangeBorderline RiskHigh Risk
LDL-P<1,000 nmol/L1,000-1,299 nmol/L≥1,300 nmol/L
Small LDL-P<300 nmol/L300-599 nmol/L≥600 nmol/L
LDL Size>20.6 nm (Pattern A)20.3-20.5 nm<20.3 nm (Pattern B)
HDL-P>35 μmol/L (M), >40 μmol/L (F)30-35 (M), 35-40 (F)<30 (M), <35 (F)
LP-IR Score<2525-44≥45

Pattern Recognition in NMR Results

  • Atherogenic lipoprotein pattern: Characterized by high LDL-P, elevated small LDL-P, and small LDL size
  • HDL deficiency pattern: Low HDL-P with normal or borderline LDL parameters
  • Insulin resistance pattern: Elevated LP-IR score with high triglycerides and low HDL-P
  • Isolated LDL elevation: High LDL-P with normal particle size and other parameters

Clinical Correlation Considerations

  • Interpretation should always consider traditional risk factors and clinical context
  • Discordance between LDL-C and LDL-P requires special attention
  • Serial testing provides more meaningful information than single measurements
  • Treatment decisions should incorporate both NMR results and global risk assessment

Our free NMR Lipoprofile Calculator integrates these interpretation principles to provide personalized risk assessment and management recommendations based on your specific results.

What Clinical Conditions Benefit Most from NMR Lipoprotein Testing?

While NMR lipoprotein testing can provide valuable insights for virtually anyone interested in cardiovascular health, several specific clinical scenarios demonstrate particularly high utility for this advanced testing modality.

Patients with Metabolic Syndrome and Diabetes
Individuals with insulin resistance conditions typically display characteristic lipoprotein patterns that NMR testing can precisely quantify. These patterns include:

  • Elevated small dense LDL particles
  • Low HDL particle number
  • Increased LP-IR score
  • Elevated triglycerides and remnant lipoproteins

NMR testing allows for more accurate risk stratification in this population and can monitor response to therapies specifically targeting atherogenic dyslipidemia.

Individuals with Family History of Premature Cardiovascular Disease
For those with strong family histories of early heart disease but normal conventional lipids, NMR testing can identify hidden risk factors such as:

  • High LDL particle number despite normal LDL cholesterol
  • Elevated lipoprotein(a) when included in expanded panels
  • Atherogenic lipoprotein patterns not apparent on standard testing

Patients with Established Cardiovascular Disease
In secondary prevention, NMR testing provides:

  • Assessment of residual risk despite achieving LDL cholesterol targets
  • Guidance for additional therapies beyond statins
  • Monitoring of comprehensive lipoprotein response to intensive treatment

Those with Borderline Traditional Risk Factors
When global risk scores indicate intermediate risk, NMR parameters can:

  • Reclassify risk upward or downward in approximately 30-40% of cases
  • Inform shared decision-making about preventive therapies
  • Provide motivation for lifestyle interventions through tangible biomarkers

How Can Our Free NMR Lipoprofile Calculator Help You?

Our proprietary NMR Lipoprofile Calculator represents a sophisticated digital tool designed to translate complex lipoprotein data into actionable health insights. This calculator integrates established clinical algorithms with cutting-edge risk prediction models to provide personalized cardiovascular risk assessment.

Comprehensive Data Integration
The calculator processes multiple data points including:

  • Standard lipid parameters (LDL-C, HDL-C, triglycerides)
  • NMR-specific metrics (LDL-P, LDL size, HDL-P)
  • Clinical and demographic information
  • Lifestyle factors and medical history

Advanced Risk Algorithm
Our proprietary algorithm incorporates:

  • Weighted scoring for each NMR parameter based on current evidence
  • Integration with traditional risk factors using validated equations
  • Pattern recognition for specific dyslipidemia phenotypes
  • Dynamic risk adjustment based on parameter interactions

Personalized Output Features

  • Color-coded risk stratification (low, moderate, high)
  • Specific interpretation of each abnormal parameter
  • Lifestyle recommendations targeted to identified abnormalities
  • Medication considerations when appropriate
  • Tracking capability for serial measurements

The calculator is particularly valuable for identifying discordance between traditional and advanced lipid parameters, a scenario where clinical decision-making becomes most challenging.

What Do Specific NMR Patterns Reveal About Your Metabolism?

Different NMR lipoprotein patterns reflect distinct underlying metabolic processes and can guide targeted interventions. Recognizing these patterns enhances the clinical utility of NMR testing beyond individual parameter assessment.

Pattern A: Large Buoyant LDL Predominance
This pattern characterized by large LDL particles (>20.6 nm) typically indicates:

  • Efficient LDL clearance via hepatic receptors
  • Lower cardiovascular risk compared to Pattern B
  • Better response to dietary cholesterol reduction
  • Often associated with higher HDL levels

Pattern B: Small Dense LDL Predominance
The atherogenic Pattern B featuring small LDL particles (<20.5 nm) suggests:

  • Insulin resistance and increased cardiovascular risk
  • Delayed clearance of LDL particles
  • Enhanced susceptibility to oxidative modification
  • Better response to carbohydrate restriction and fibrates

Mixed or Intermediate Pattern
This pattern with a broad distribution of LDL sizes often represents:

  • Transition between Pattern A and Pattern B
  • Partial metabolic dysfunction
  • Response to ongoing lifestyle or pharmacological interventions

High HDL Particle Number Pattern
Elevated HDL-P with large HDL particles typically indicates:

  • Efficient reverse cholesterol transport
  • Lower cardiovascular risk
  • Possible genetic determinants
  • Generally favorable metabolic status

Low HDL Particle Number Pattern
Reduced HDL-P, especially with small HDL particles, suggests:

  • Impaired reverse cholesterol transport
  • Increased cardiovascular risk
  • Association with metabolic syndrome
  • Potential benefit from niacin or fibrates

Understanding these patterns allows for targeted interventions that address the specific metabolic disturbances identified through NMR testing.

How Does Lifestyle Modification Impact NMR Lipoprotein Parameters?

Specific lifestyle interventions produce characteristic changes in NMR-measured lipoprotein parameters, often before significant alterations occur in traditional lipid measurements. Understanding these relationships empowers individuals to make targeted lifestyle changes.

Dietary Interventions

  • Low-carbohydrate diets: Typically produce dramatic reductions in small LDL particles, triglycerides, and LP-IR score
  • Mediterranean diets: Generally improve LDL particle number, HDL particle number, and LDL size
  • Low-fat diets: Often reduce LDL cholesterol but may paradoxically increase small LDL particles in susceptible individuals
  • Intermittent fasting: Can improve multiple NMR parameters including LDL-P, HDL-P, and LP-IR score

Exercise Modalities

  • Aerobic exercise: Consistently improves LDL particle size, reduces small LDL-P, and increases HDL-P
  • Resistance training: Shows particular benefit for reducing LP-IR score and improving HDL metrics
  • High-intensity interval training: Produces rapid improvements in multiple NMR parameters including LDL-P and triglyceride-rich lipoproteins

Weight Management Impact

  • Modest weight loss (5-10%): Typically reduces LDL-P, small LDL-P, and LP-IR score
  • Substantial weight loss (>10%): Often normalizes multiple NMR parameters including LDL size pattern
  • Weight cycling: May adversely affect LDL particle characteristics independent of absolute weight

Other Lifestyle Factors

  • Sleep optimization: Improves LP-IR score and LDL particle quality
  • Stress reduction: Can positively impact LDL-P and HDL-P
  • Alcohol moderation: Moderate consumption may improve HDL-P but excess worsens triglycerides
  • Smoking cessation: Dramatically improves multiple NMR parameters including small LDL-P

Our NMR Lipoprofile Calculator incorporates these evidence-based relationships to generate personalized lifestyle recommendations based on your specific pattern of abnormalities.

What Pharmaceutical Interventions Specifically Target NMR Abnormalities?

Different classes of lipid-modifying medications produce distinct effects on NMR-measured lipoprotein parameters. Understanding these medication-specific effects allows for targeted therapy based on individual NMR patterns.

Statin Medications

  • Primary effect: Substantial reduction in LDL particle number
  • Variable effects: Modest reduction in small LDL-P, minimal effect on LDL size
  • Clinical implication: First-line for elevated LDL-P regardless of pattern
  • Monitoring: LDL-P provides superior assessment of residual risk compared to LDL-C

Fibrates

  • Primary effect: Dramatic reduction in small LDL particles and triglycerides
  • Variable effects: Modest increase in LDL size, improvement in HDL-P
  • Clinical implication: Particularly beneficial for Pattern B dyslipidemia
  • Combination therapy: Enhanced small LDL reduction when combined with statins

Niacin

  • Primary effect: Significant increase in LDL particle size, reduction in LP-IR
  • Variable effects: Modest reduction in LDL-P, substantial increase in HDL-P
  • Clinical implication: Useful for mixed dyslipidemia with small LDL particles
  • Limitations: Side effect profile may limit tolerability

PCSK9 Inhibitors

  • Primary effect: Profound reduction in LDL particle number
  • Variable effects: Reduction in small LDL-P, minimal effect on LDL size
  • Clinical implication: Powerful option for very high LDL-P despite statins
  • Monitoring: NMR testing can identify pattern changes with therapy

Omega-3 Fatty Acids

  • Primary effect: Dose-dependent reduction in triglycerides and remnant lipoproteins
  • Variable effects: Modest increase in LDL size, reduction in LP-IR score
  • Clinical implication: Particularly beneficial with elevated triglycerides
  • Prescription formulations: More potent effects on NMR parameters than supplements

GLP-1 Receptor Agonists and SGLT2 Inhibitors

  • Primary effect: Significant improvement in LP-IR score
  • Variable effects: Reduction in small LDL-P, increase in HDL-P
  • Clinical implication: Dual benefit for diabetes and cardiovascular risk reduction
  • Emerging evidence: Potentially favorable effects on multiple NMR parameters

Our calculator incorporates these medication-specific effects when generating recommendations, particularly for individuals already on lipid-modifying therapy.

How Often Should You Repeat NMR Lipoprotein Testing?

The optimal frequency for repeat NMR testing depends on clinical context, baseline abnormalities, and interventions implemented. General guidelines can be tailored to individual circumstances.

Initial Abnormalities Requiring Intervention

  • Repeat testing: 8-12 weeks after initiating lifestyle changes
  • Follow-up: 4-6 weeks after starting or adjusting medications
  • Monitoring: Every 3-6 months until goals achieved
  • Maintenance: Every 6-12 months once stable

Normal Baseline with Risk Factors

  • Repeat testing: Annually for high-risk individuals
  • Follow-up: Every 2-3 years for moderate risk
  • Consideration: More frequent testing with weight changes or new diagnoses

Specific Clinical Scenarios

  • Metabolic surgery: Testing at 3, 6, and 12 months post-procedure
  • Intensive lifestyle intervention: Monthly testing during active weight loss phase
  • Medication titration: 4-6 week intervals during dose adjustment
  • Pregnancy: Preconception, each trimester, and postpartum assessment

Factors Influencing Testing Frequency

  • Magnitude of initial abnormalities
  • Rapidity of response to interventions
  • Development of new risk factors
  • Changes in clinical status
  • Patient motivation and engagement

Serial NMR testing provides valuable information about trajectory of change and can reveal patterns not apparent from single measurements. Our calculator includes tracking functionality to monitor changes over time.

What Are the Limitations and Considerations of NMR Testing?

While NMR lipoprotein testing provides superior information compared to conventional lipid panels, several important limitations and considerations should inform appropriate clinical use.

Technical Considerations

  • Measurement variability: Although generally low, biological and analytical variability exists
  • Standardization: Differences between NMR instruments from various manufacturers
  • Reference ranges: Population-specific norms may not apply to all ethnic groups
  • Fasting status: Some parameters (triglycerides) require fasting while others (LDL-P) do not

Clinical Interpretation Challenges

  • Overreliance on single parameters: Comprehensive pattern analysis is essential
  • Discordance management: How to proceed when traditional and advanced parameters conflict
  • Cost-effectiveness: Appropriate patient selection to maximize value
  • Result communication: Effectively explaining complex results to patients

Integration with Other Risk Assessment Tools

  • Global risk scores: How to incorporate NMR data into established algorithms
  • Novel biomarkers: Relationship with other advanced markers like coronary calcium scoring
  • Genetic information: Integration with polygenic risk scores and familial hypercholesterolemia testing

Economic and Access Considerations

  • Insurance coverage: Variable reimbursement across payers and indications
  • Test availability: Limited access in some geographical regions
  • Opportunity cost: Allocation of finite healthcare resources

Understanding these limitations ensures appropriate utilization and interpretation of NMR lipoprotein testing in clinical practice.

Frequently Asked Questions About NMR Lipoprotein Testing

What is the difference between LDL cholesterol and LDL particle number?
LDL cholesterol measures the cholesterol content within LDL particles, while LDL particle number counts the actual number of LDL particles. Research shows particle number better predicts cardiovascular risk because atherosclerosis development depends on particle penetration into the arterial wall, not just cholesterol content.

Is fasting necessary before NMR lipoprotein testing?
For complete assessment including triglycerides, 12-hour fasting is recommended. However, LDL particle number remains relatively stable postprandially, so non-festing testing can still provide valuable information when fasting is impractical.

Can NMR testing replace traditional lipid panels?
NMR testing provides more comprehensive information but currently complements rather than replaces standard lipid testing. Many clinicians use both approaches, with NMR providing advanced risk stratification when traditional panels show borderline or discordant results.

How does NMR testing compare to other advanced lipid tests?
NMR directly measures lipoprotein particles using magnetic properties, while other methods like vertical auto profile (VAP) testing use density ultracentrifugation. NMR generally provides more detailed particle size and number data with excellent reproducibility.

Does insurance typically cover NMR lipoprotein testing?
Coverage varies by insurer and clinical indication. Many plans cover NMR testing for specific scenarios like diabetes, metabolic syndrome, family history of premature heart disease, or recurrent events despite optimal traditional lipids.

Can lifestyle changes significantly improve NMR parameters?
Yes, targeted lifestyle interventions often produce dramatic improvements in NMR parameters, particularly small LDL particles, LDL size, and LP-IR score. Dietary modification, exercise, and weight loss typically show effects within 8-12 weeks.

How often should NMR testing be repeated?
For individuals with abnormal results undergoing interventions, repeat testing every 3-6 months initially, then annually once stabilized. Those with normal results and lower risk profiles may repeat testing every 2-5 years depending on risk factor status.

Disclaimer

The information provided in this article and calculator is for educational purposes only and does not constitute medical advice. Consult with a qualified healthcare professional for personalized medical guidance and before making any changes to your health management plan.

Based on comprehensive analysis of market trends and commission structures, these affiliate products align perfectly with NMR lipoprotein testing and cardiovascular health:

Premium Omega-3 Supplements

  • Nordic Naturals Ultimate Omega: Pharmaceutical-grade fish oil with high EPA/DHA concentration
  • Viva Naturals Triple Strength Omega-3: Potent formulation with excellent bioavailability
  • Sports Research Triple Strength Omega-3: Triglyceride form for enhanced absorption

Advanced Cholesterol Management Supplements

  • CholestOff Complete by Nature Made: Plant sterols with clinically demonstrated efficacy
  • Bergamonte Bergamot Extract: Natural supplement shown to improve LDL pattern
  • Sytrinol Proprietary Formula: Citrus and palm fruit extract with lipid-modifying properties

Home Testing and Monitoring Devices

  • CardioChek Plus Analyzer: Professional-grade home lipid testing system
  • Keto-Mojo GK+ Bluetooth Glucose & Ketone Testing Kit: Dual parameter monitoring for metabolic health
  • Withings BPM Connect Smart Blood Pressure Monitor: Medical-grade home BP tracking

Lifestyle Intervention Programs

  • Virta Health Clinic: Medical nutrition therapy for type 2 diabetes and metabolic health
  • Noom Weight Loss Program: Psychology-based approach to sustainable weight management
  • Fitbit Premium with Health Coaching: Integrated activity tracking and personalized guidance

Educational Resources and Courses

  • Mastering Diabetes Online Course: Evidence-based approach to insulin resistance reversal
  • The End of Dieting Masterclass by Dr. Joel Fuhrman: Nutritarian approach to cardiovascular health
  • ZOE Personalized Nutrition Program: Gut microbiome and metabolic health testing with coaching

Pelvic-MRI-Comprehensive-Pelvic-Floor-Imaging

Pelvic MRI: Comprehensive Pelvic Floor Imaging

Pelvic MRI represents a revolutionary advancement in diagnostic imaging, providing unparalleled visualization of pelvic structures without radiation exposure. This comprehensive guide explores everything from basic preparation to advanced interpretation of pelvic magnetic resonance imaging, empowering patients and healthcare professionals with essential knowledge about this critical diagnostic tool. Our exclusive pelvic MRI preparation calculator helps optimize your scan experience and results.

What You’ll Learn From This Guide

  • Understanding pelvic MRI indications and clinical applications
  • Step-by-step preparation protocols for optimal results
  • Interpretation of findings and common pathological conditions
  • Advanced pelvic floor dysfunction assessment techniques
  • Future innovations in pelvic magnetic resonance imaging

Pelvic MRI Preparation Checklist

Pelvic MRI Preparation Checklist

Complete this comprehensive checklist to prepare for your pelvic MRI procedure

1
Demographics
2
Medical History
3
Clinical Details
4
Results

Personal Information

Medical History

Hold Ctrl/Cmd to select multiple options
mmHg
mmHg

Clinical Details

0

Preparation Assessment

0%
Low Risk
Medium Risk
High Risk

Interpretation

Based on your inputs, your pelvic MRI preparation score is calculated. A higher score indicates better preparation and lower risk of complications.

Recommendations

  • Follow all pre-procedure instructions provided by your healthcare provider
  • Inform the MRI technician of any metal implants or devices
  • Wear comfortable, metal-free clothing to your appointment

Disclaimer: This tool is for informational purposes only and is not a substitute for professional medical advice. Always consult with a qualified healthcare provider for medical guidance.

`); reportWindow.document.close(); // After the content is loaded, print the window reportWindow.onload = function() { reportWindow.print(); }; } });

Try More Free Tools:

Free-Pelvic-MRI-Comprehensive-Pelvic-Floor-Imaging

What is Pelvic MRI and How Does It Work?

Pelvic magnetic resonance imaging (MRI) is a non-invasive diagnostic procedure that uses powerful magnetic fields and radio waves to generate detailed images of pelvic organs and structures. Unlike CT scans or X-rays, MRI doesn’t use ionizing radiation, making it particularly valuable for repeated imaging and sensitive patient populations.

The technology operates on the principle of nuclear magnetic resonance, where hydrogen atoms in the body’s tissues align with the magnetic field. When radiofrequency pulses are applied, these atoms emit signals that are detected by specialized coils and transformed into cross-sectional images by sophisticated computer algorithms.

Modern pelvic MRI systems typically operate at field strengths of 1.5 Tesla or 3.0 Tesla, with higher field strengths providing greater spatial resolution. The procedure excels at visualizing soft tissues, making it ideal for assessing pelvic floor muscles, reproductive organs, bladder, rectum, and supporting structures.

Key advantages of pelvic MRI include:

  • Multiplanar imaging capability (axial, sagittal, coronal)
  • Excellent soft tissue contrast resolution
  • Functional assessment with dynamic sequences
  • No ionizing radiation exposure
  • Comprehensive evaluation of pelvic floor compartments

Why Would Someone Need a Pelvic MRI Scan?

Pelvic MRI serves as a crucial diagnostic tool for numerous clinical scenarios across multiple medical specialties. The scan’s ability to provide detailed soft tissue characterization makes it indispensable for evaluating complex pelvic pathology that other imaging modalities might miss.

Common clinical indications include:

  • Unexplained chronic pelvic pain evaluation
  • Suspected pelvic organ prolapse assessment
  • Endometriosis diagnosis and staging
  • Uterine fibroid characterization and mapping
  • Ovarian mass characterization and cancer staging
  • Prostate cancer detection and local staging
  • Rectal cancer staging and treatment response assessment
  • Inflammatory bowel disease complications
  • Pelvic floor dysfunction evaluation
  • Congenital anomalies investigation
  • Post-surgical complication assessment
  • Infertility workup

For obstetric applications, pelvic MRI plays a special role in evaluating placental abnormalities, fetal development issues, and maternal conditions that might complicate pregnancy. The absence of radiation makes it safer than CT during pregnancy, particularly after the first trimester.

Recent clinical guidelines from major radiological societies emphasize the growing importance of pelvic MRI in preoperative planning for complex pelvic surgeries, cancer staging, and monitoring treatment response for various pelvic malignancies.

How Does Pelvic MRI Differ From Other Imaging Modalities?

Understanding the distinct advantages of pelvic MRI compared to other imaging techniques helps clinicians and patients make informed decisions about diagnostic approaches. Each modality offers unique benefits depending on the clinical question being addressed.

Comparison with CT Scanning

  • MRI provides superior soft tissue contrast without radiation
  • CT offers faster acquisition times and better bone detail
  • CT preferred for acute trauma and calcification detection
  • MRI superior for tumor characterization and pelvic floor assessment

Comparison with Ultrasound

  • Transvaginal/transrectal ultrasound provides real-time imaging
  • Ultrasound more accessible and less expensive
  • MRI offers comprehensive multiplanar assessment
  • MRI better for deep infiltrating endometriosis and complex masses

Comparison with Fluoroscopy

  • Dynamic fluoroscopy shows real-time functional changes
  • MRI provides detailed anatomical information without radiation
  • Both used for defecography and voiding studies
  • MRI defecography gaining popularity for comprehensive assessment

Specialized MRI techniques like diffusion-weighted imaging, dynamic contrast enhancement, and spectroscopy provide functional information beyond anatomical depiction, offering insights into tissue cellularity, vascularity, and metabolic characteristics.

What Are the Different Types of Pelvic MRI Protocols?

Modern pelvic imaging employs specialized protocols tailored to specific clinical questions. Understanding these variations helps patients comprehend what to expect during their examination and why certain sequences are performed.

Standard Pelvic MRI Protocol
Includes T1-weighted, T2-weighted, and fat-suppressed sequences in multiple planes. This comprehensive approach provides general anatomical overview and detects most common pathologies.

Pelvic Floor MRI Protocol
Specifically designed for evaluating pelvic floor dysfunction, this protocol often includes dynamic imaging during straining and defecation. Key elements include:

  • High-resolution static images in three planes
  • Dynamic TrueFISP or single-shot T2-weighted sequences
  • Rest, squeeze, strain, and defecation phases
  • Cinedynamic display for functional assessment

Oncological Pelvic MRI Protocol
Optimized for tumor detection, characterization, and staging, this protocol includes:

  • Diffusion-weighted imaging with ADC mapping
  • Dynamic contrast-enhanced sequences
  • Multiparametric analysis for prostate cancer
  • Whole-body imaging for metastatic workup

Enterography MRI Protocol
Designed for small bowel and colorectal assessment, this technique utilizes:

  • Large volume oral contrast administration
  • Cinematic display for peristalsis evaluation
  • Diffusion-weighted imaging for inflammation detection
  • Post-contrast sequences for enhancement patterns

Recent technological advances have introduced accelerated acquisition techniques like compressed sensing and simultaneous multi-slice imaging, significantly reducing scan times while maintaining diagnostic quality.

How to Prepare for a Pelvic MRI Examination?

Proper preparation significantly enhances examination quality and diagnostic accuracy. Our pelvic MRI preparation calculator incorporates these essential elements to help patients optimize their scan experience.

Dietary Preparation Guidelines

  • Fasting for 4-6 hours before contrast-enhanced studies
  • Light meal permitted for non-contrast examinations
  • Avoid gas-producing foods for 24 hours before scanning
  • Maintain adequate hydration unless instructed otherwise

Bowel Preparation Protocols

  • Rectal cleansing may be required for rectal cancer staging
  • Microenemas sometimes used for pelvic floor MRI
  • No routine bowel preparation for standard pelvic MRI
  • Specific instructions provided based on clinical indication

Medication Management

  • Continue most regular medications unless specified
  • Special instructions for diabetic patients regarding insulin
  • Potential adjustment of blood thinners per referring physician
  • Documentation of all current medications

Clothing and Personal Items

  • Change into hospital gown without metal fasteners
  • Remove all jewelry, hairpins, and metallic objects
  • Avoid makeup with metallic particles
  • Leave valuables and electronic devices outside scan room

Patient Education Components

  • Detailed explanation of procedure and sequences
  • Breathing instruction practice session
  • Communication system demonstration
  • Emergency contact information verification

Our preparation calculator incorporates these elements into a personalized checklist based on individual patient factors, ensuring comprehensive readiness for the examination.

What Safety Considerations Apply to Pelvic MRI?

MRI safety represents a critical aspect of patient care, requiring systematic screening and protocol adherence to prevent adverse events. Understanding these considerations helps patients navigate the process safely.

Metallic Implant Screening
Complete documentation of all implanted devices is essential. Specific considerations include:

  • Cardiac pacemakers and defibrillators require special protocols
  • Cochlear implants may have MRI compatibility limitations
  • Cerebral aneurysm clips need specific compatibility verification
  • Orthopedic implants generally safe but may cause artifacts

Contrast Agent Safety
Gadolinium-based contrast agents require specific precautions:

  • Screening for renal impairment (eGFR calculation)
  • Pregnancy and breastfeeding considerations
  • History of previous contrast reactions
  • Nephrogenic systemic fibrosis risk assessment

Claustrophobia Management
Approximately 2-10% of patients experience significant anxiety:

  • Pre-scan counseling and environment familiarization
  • Open MRI systems for severely claustrophobic patients
  • Sedation protocols for anxious individuals
  • Distraction techniques and communication maintenance

Acoustic Noise Protection
MRI systems generate significant noise during operation:

  • Earplugs or headphones provided for all patients
  • Special consideration for patients with hearing aids
  • Acoustic reduction techniques in modern systems
  • Communication maintenance despite noise

Recent safety innovations include ferromagnetic detection systems, improved implant labeling, and advanced contrast agents with better safety profiles.

What Happens During the Actual Pelvic MRI Procedure?

Understanding the step-by-step process helps alleviate patient anxiety and improves cooperation during the examination. The typical pelvic MRI lasts 30-60 minutes depending on the protocol.

Patient Positioning and Coil Placement

  • Supine position with feet typically positioned first
  • Phased-array surface coil placed over pelvis
  • Comfort measures including padding and blankets
  • Laser positioning for accurate landmarking

Breathing Instructions
Specific breathing commands optimize image quality:

  • Quiet breathing for most sequences
  • Breath-hold periods for certain dynamic sequences
  • Practice sessions before actual scanning
  • Consistent breathing pattern maintenance

Sequence Acquisition
Multiple sequences acquired in succession:

  • Localizer scans for planning
  • T2-weighted turbo spin echo sequences
  • T1-weighted gradient echo sequences
  • Diffusion-weighted imaging
  • Dynamic contrast-enhanced imaging

Contrast Administration
When required, gadolinium-based contrast injected:

  • Power injector used for consistent timing
  • Saline flush to ensure complete delivery
  • Timing of post-contrast sequences critical
  • Monitoring for any adverse reactions

Throughout the procedure, technologists maintain communication with patients, providing updates and reassurance. The magnetic field remains active continuously, while gradient switching produces the characteristic knocking sounds.

How is Pelvic MRI Used for Pelvic Floor Assessment?

Pelvic floor MRI represents a specialized application providing comprehensive evaluation of pelvic support structures and functional dynamics. This technique has revolutionized understanding of pelvic floor disorders.

Three-Compartment Model Assessment
Modern pelvic floor evaluation utilizes the three-compartment approach:

  • Anterior compartment: bladder, urethra, and supporting structures
  • Middle compartment: vagina, cervix, and uterus
  • Posterior compartment: rectum, anal canal, and supporting muscles

Dynamic Imaging Techniques
Functional assessment during various maneuvers:

  • Resting state for baseline anatomy
  • Maximal pelvic floor contraction (squeeze)
  • Valsalva maneuver for descent evaluation
  • Defecation phase for comprehensive assessment

Quantitative Measurement Parameters
Standardized measurements for objective assessment:

  • Pubococcygeal line reference measurements
  • Organ descent quantification in millimeters
  • Hiatal dimensions and area calculations
  • Levator ani muscle integrity scoring

Clinical Applications and Impact
Pelvic floor MRI significantly impacts management:

  • Surgical planning for prolapse repair
  • Identification of occult sphincter injuries
  • Assessment of mesh complications
  • Evaluation of defecatory dysfunction causes

Recent advances include diffusion tensor imaging of pelvic floor muscles, 3D modeling for surgical planning, and artificial intelligence applications for automated measurements.

What Can Pelvic MRI Detect and Diagnose?

Pelvic MRI’s exceptional soft tissue resolution enables detection of numerous pathological conditions across multiple organ systems. Understanding these diagnostic capabilities helps contextualize examination results.

Gynecological Conditions

  • Uterine fibroids: location, size, and degeneration assessment
  • Adenomyosis: junctional zone characterization and extent
  • Endometriosis: deep infiltrating lesions and adhesions
  • Congenital anomalies: Mullerian duct abnormalities
  • Ovarian masses: characterization and staging

Urological Applications

  • Prostate cancer: detection, localization, and staging
  • Bladder cancer: local staging and muscle invasion
  • Urinary incontinence: sphincter and support assessment
  • Congenital anomalies: ectopic ureters and duplication

Colorectal Pathology

  • Rectal cancer: T and N staging accuracy
  • Inflammatory bowel disease: complications assessment
  • Perianal fistulas: classification and surgical planning
  • Defecatory disorders: functional and structural causes

Musculoskeletal Conditions

  • Sacroiliac joint inflammation and arthritis
  • Pelvic bone marrow abnormalities and metastases
  • Soft tissue tumors and masses
  • Athletic pubalgia and sports-related injuries

Emerging applications include prostate cancer screening in high-risk populations, endometriosis classification systems, and treatment response assessment for various pelvic malignancies.

How to Interpret Pelvic MRI Findings?

Understanding basic interpretation principles helps patients and referring physicians comprehend reported findings. While formal interpretation requires radiological expertise, certain fundamental concepts enhance communication.

Normal Anatomical Landmarks
Recognition of normal structures provides context:

  • Zonal anatomy of prostate in males
  • Endometrial and myometrial differentiation in females
  • Pelvic floor muscle symmetry and bulk
  • Organ relationships and support structures

Common Pathological Patterns
Characteristic appearances of frequent conditions:

  • Fibroids: well-circumscribed, T2 dark lesions
  • Endometriosis: T1 bright “shading” in endometriomas
  • Malignancies: restricted diffusion and enhancement
  • Inflammation: edema and enhancement patterns

Quantitative Assessment Parameters
Objective measurements for standardized reporting:

  • Tumor size and volume calculations
  • Diffusion coefficient (ADC) values
  • Enhancement kinetics parameters
  • Organ descent measurements

Staging Systems and Classification
Standardized approaches for common conditions:

  • FIGO staging for gynecological malignancies
  • TNM classification for rectal and prostate cancer
  • International Endometriosis Classification
  • Pelvic Organ Prolapse Quantification (POP-Q)

Recent developments include structured reporting templates, quantitative imaging biomarkers, and computer-aided detection systems improving diagnostic consistency and accuracy.

What Are the Limitations and Challenges of Pelvic MRI?

Despite its numerous advantages, pelvic MRI faces specific limitations that influence its appropriate application and interpretation. Understanding these constraints ensures realistic expectations.

Technical Limitations

  • Metallic artifact from implants and surgical materials
  • Limited availability and higher cost compared to ultrasound
  • Longer examination times than CT scanning
  • Claustrophobia and patient cooperation requirements

Diagnostic Challenges

  • Limited sensitivity for calcification detection
  • Difficulty distinguishing post-treatment changes from recurrence
  • Variable appearance of normal tissues across patients
  • Operator dependence for dynamic sequences

Access and Economic Factors

  • Geographic variability in availability
  • Insurance coverage variations for specific indications
  • Time-consuming interpretation requiring specialist expertise
  • Equipment maintenance and operational costs

Future Development Areas
Current research addresses these limitations through:

  • Artificial intelligence for accelerated acquisition and interpretation
  • Improved metal artifact reduction techniques
  • Standardized protocols and reporting systems
  • Cost-reduction strategies through workflow optimization

Understanding these limitations helps clinicians select the most appropriate imaging modality for specific clinical scenarios and manage patient expectations appropriately.

What Recent Advances Are Transforming Pelvic MRI?

Technological innovations continuously enhance pelvic MRI capabilities, improving diagnostic accuracy, patient experience, and clinical applications. Several cutting-edge developments deserve particular attention.

Artificial Intelligence Integration
Machine learning algorithms revolutionizing pelvic MRI:

  • Automated organ segmentation and measurement
  • Lesion detection and characterization assistance
  • Protocol optimization and parameter selection
  • Workflow efficiency improvements

Quantitative Imaging Biomarkers
Objective measurements replacing subjective assessment:

  • Diffusion-weighted imaging ADC values
  • Dynamic contrast-enhanced pharmacokinetic parameters
  • Texture analysis for tissue characterization
  • Radiomics for outcome prediction

Hybrid Imaging Systems
Combined modalities providing comprehensive information:

  • PET-MRI for oncological staging
  • MRI-ultrasound fusion for targeted biopsies
  • Intraoperative MRI guidance systems
  • MR-linear accelerator for radiation therapy

Patient-Centered Innovations
Improvements focusing on patient experience:

  • Reduced acoustic noise systems
  • Faster acquisition techniques minimizing motion
  • Open-bore designs for claustrophobic patients
  • Enhanced communication systems

These advances collectively improve diagnostic confidence, expand clinical applications, and enhance the overall patient experience during pelvic MRI examinations.

How Does Pelvic MRI Impact Treatment Planning and Monitoring?

The information obtained from pelvic MRI significantly influences therapeutic decisions across multiple medical specialties, serving as a crucial tool for personalized medicine approaches.

Surgical Planning Applications

  • Tumor resectability assessment and margin prediction
  • Vascular mapping for surgical approach planning
  • Nerve-sparing procedure guidance
  • Reconstructive surgery planning

Radiation Therapy Applications

  • Target volume delineation precision
  • Organs at risk identification and protection
  • Adaptive therapy based on treatment response
  • Brachytherapy planning optimization

Medical Therapy Monitoring

  • Treatment response assessment in oncology
  • Disease activity monitoring in inflammatory conditions
  • Complication detection during medical therapy
  • Guidance for therapy modification

Interventional Procedure Guidance

  • Targeted biopsy planning for prostate cancer
  • Drainage procedure planning for collections
  • Ablation therapy planning and monitoring
  • Embolization procedure guidance

The integration of pelvic MRI findings into multidisciplinary team discussions has demonstrated improved patient outcomes, particularly in oncology, where precise staging directly influences treatment selection and sequencing.

What is the Future Direction of Pelvic MRI Development?

Pelvic MRI continues evolving rapidly, with several promising directions likely to transform clinical practice in the coming years. Understanding these trajectories helps patients and providers anticipate future capabilities.

Technical Innovation Pathways

  • Ultra-high field systems (7T and beyond) for microscopic resolution
  • Integrated artificial intelligence for real-time interpretation
  • Compact and portable systems improving accessibility
  • Multinuclear imaging expanding metabolic assessment

Clinical Application Expansion

  • Screening applications in high-risk populations
  • Quantitative biomarkers for personalized therapy
  • Functional assessment beyond anatomical imaging
  • Interventional and therapeutic applications

Workflow Optimization Focus

  • Dramatically reduced acquisition times
  • Automated analysis and reporting systems
  • Seamless integration with electronic health records
  • Remote interpretation and consultation capabilities

Patient Experience Enhancement

  • Significantly reduced examination times
  • Personalized protocols based on individual characteristics
  • Enhanced comfort and communication systems
  • Integrated education and support resources

These developments promise to make pelvic MRI more accessible, informative, and patient-friendly while expanding its role in diagnosis, treatment planning, and monitoring across numerous clinical scenarios.

Frequently Asked Questions About Pelvic MRI

How long does a pelvic MRI take?
A standard pelvic MRI examination typically requires 30-45 minutes, while specialized protocols like pelvic floor MRI or multiparametric prostate MRI may take 45-60 minutes. The duration depends on the specific clinical questions being addressed and the sequences required.

Is pelvic MRI safe during pregnancy?
Pelvic MRI is generally avoided during the first trimester unless absolutely necessary. During second and third trimesters, it may be performed when clinically indicated, preferably without contrast agents. The referring physician and radiologist carefully weigh benefits against potential risks.

What is the difference between MRI and MRl?
MRI stands for Magnetic Resonance Imaging, while “MRl” is typically a typographical error. The correct abbreviation is MRI, representing the diagnostic imaging technique that uses magnetic fields and radio waves to generate detailed body images.

Can pelvic MRI detect cancer?
Yes, pelvic MRI excels at detecting and characterizing various cancers, including prostate, rectal, cervical, endometrial, ovarian, and bladder malignancies. Its superior soft tissue resolution helps identify tumors, determine their extent, and guide treatment planning.

How much does a pelvic MRI cost?
Pelvic MRI costs vary significantly by geographic location, facility type, and insurance coverage. In the United States, costs typically range from $500 to $3,000 without insurance. Insurance co-pays generally range from $100 to $500 depending on the specific plan.

What should I wear for a pelvic MRI?
Patients should wear comfortable, metal-free clothing or change into a hospital gown. All metallic objects including jewelry, hairpins, watches, and clothing with metal fasteners must be removed to ensure safety and image quality during the examination.

Disclaimer: This article provides educational information only and does not constitute medical advice. Always consult qualified healthcare professionals for personalized medical guidance. The pelvic MRI preparation calculator offers general guidance but cannot replace individualized medical instructions.

Shoulder-MRI-Rotator-Cuff-and-Joint-Imaging

Shoulder MRI: Rotator Cuff and Joint Imaging

Shoulder MRI represents one of the most advanced diagnostic imaging techniques for evaluating rotator cuff pathology, labral tears, and joint abnormalities. This comprehensive guide explores shoulder anatomy, MRI interpretation, clinical correlations, and treatment considerations through detailed analysis of imaging findings, symptom patterns, and functional assessments. Understanding shoulder MRI requires knowledge of complex anatomical structures, injury mechanisms, and the relationship between imaging findings and clinical symptoms.

What You’ll Learn From This Guide

• Shoulder anatomy and biomechanics explained
• MRI sequences and their diagnostic significance
• Rotator cuff tear classification and management
• Labral injuries and instability patterns
• Bone marrow edema and cartilage assessment
• Clinical correlation with imaging findings
• Treatment options based on MRI results
• Rehabilitation protocols and recovery timelines

Shoulder MRI Results Interpreter | Doseway

Shoulder MRI Results Interpreter

Comprehensive analysis of your shoulder MRI findings with personalized recommendations

Demographics
Medical History
MRI Findings
Symptoms & Function
Results

Patient Demographics

cm
ft/in
kg
lbs

Medical History

MRI Findings

Symptoms & Functional Assessment

0/10

Your Shoulder MRI Assessment

0

Shoulder Pathology Severity Score

Minimal Mild Moderate Severe

Interpretation

Based on your MRI findings and symptoms, your shoulder condition appears to be within normal limits with minimal pathology.

Personalized Recommendations

  • Continue with regular activities as tolerated
  • Maintain shoulder mobility with gentle stretching
  • Consider periodic follow-up if symptoms change

Disclaimer: This tool provides educational information only and is not a substitute for professional medical advice. Always consult with a qualified healthcare provider for diagnosis and treatment of medical conditions.

Try More Free Tools:

Free-Shoulder-MRI-Rotator-Cuff-and-Joint-Imaging

Understanding Shoulder Anatomy: The Foundation of MRI Interpretation

The shoulder complex represents the most mobile joint in the human body, comprising multiple articulations, muscle groups, and connective tissues that work in synchrony. The glenohumeral joint, acromioclavicular joint, sternoclavicular joint, and scapulothoracic articulation create a sophisticated kinematic chain that enables extensive range of motion while maintaining stability. The rotator cuff muscles—supraspinatus, infraspinatus, teres minor, and subscapularis—form a critical dynamic stabilizer system that centers the humeral head within the shallow glenoid fossa.

The superior labrum anterior to posterior (SLAP) complex provides crucial stability to the biceps anchor and superior glenoid, while the inferior glenohumeral ligament labral complex serves as the primary static stabilizer against anterior dislocation. Understanding these anatomical relationships is fundamental to interpreting shoulder MRI findings accurately and correlating them with clinical symptoms. The subacromial-subdeltoid bursa, long head of biceps tendon, and coracoacromial arch complete the anatomical picture that radiologists and orthopedic specialists evaluate systematically.

Key anatomical structures visible on shoulder MRI include:

  • Rotator cuff muscles and tendons
  • Glenoid labrum and joint capsule
  • Biceps tendon and pulley system
  • Acromioclavicular joint
  • Glenohumeral articular cartilage
  • Bone marrow and cortical structures
  • Bursae and synovial tissues

How Does Shoulder MRI Work? Imaging Principles and Protocols

Magnetic resonance imaging utilizes powerful magnetic fields and radiofrequency pulses to generate detailed cross-sectional images of shoulder structures without ionizing radiation. The hydrogen protons in water molecules align with the magnetic field, and when disturbed by radio waves, emit signals that are processed into anatomical images. Shoulder MRI protocols typically include T1-weighted, T2-weighted, proton density, and fat-suppressed sequences in axial, coronal oblique, and sagittal oblique planes to optimize visualization of specific structures.

Advanced MRI techniques including MR arthrography significantly improve detection of labral tears, partial rotator cuff tears, and capsular injuries by distending the joint capsule with contrast material. The ABER (abduction external rotation) position during MR arthrography provides exceptional visualization of the inferior glenohumeral ligament and anterior labroligamentous structures. Modern 3T MRI scanners offer superior spatial resolution compared to 1.5T systems, enabling detection of smaller tears and earlier degenerative changes.

Essential MRI sequences for shoulder evaluation:

  • T1-weighted: Excellent anatomical detail
  • T2-weighted: Fluid-sensitive for inflammation and tears
  • Proton density: Balanced contrast for tendon pathology
  • Fat-suppressed T2: Enhanced fluid visualization
  • Gradient echo: Sensitive for labral tears and hemorrhage

What Are the Clinical Indications for Shoulder MRI?

Shoulder MRI is indicated when patients present with persistent pain, weakness, or functional limitations despite conservative management, or when specific clinical signs suggest structural pathology. The most common indications include suspected rotator cuff tears, labral injuries in overhead athletes, instability evaluation, impingement syndrome refractory to treatment, and unexplained shoulder pain with normal radiographs. MRI provides crucial preoperative information for surgical planning, including tear size, tendon retraction, muscle quality, and associated pathology that significantly impacts treatment decisions and prognostic predictions.

Patients with acute trauma and clinical suspicion of rotator cuff tear in those over 40 years, shoulder dislocation in young athletes, or suspected biceps tendon rupture benefit from prompt MRI evaluation. Overhead athletes with internal impingement, swimmers with persistent pain, and laborers with weakness typically require MRI to exclude partial-thickness rotator cuff tears or superior labral pathology. In cases of suspected infection, neoplasm, or inflammatory arthritis, MRI with contrast administration helps characterize the process and guide management.

Clinical scenarios warranting shoulder MRI:

  • Failed conservative therapy for 6-12 weeks
  • Significant trauma with weakness or deformity
  • Suspected full-thickness rotator cuff tear
  • Preoperative planning for shoulder surgery
  • Unexplained shoulder pain with normal X-rays
  • Suspected labral tear in throwing athletes
  • Evaluation of mass lesions or infection

How to Interpret Rotator Cuff Pathology on MRI

Rotator cuff evaluation begins with assessment of tendon morphology, signal characteristics, and muscle quality on multiple imaging planes. Normal tendons demonstrate low signal intensity on all pulse sequences, while tendinosis appears as intermediate signal without discontinuity. Partial-thickness tears manifest as fluid signal extending to either the articular or bursal surface, while full-thickness tears demonstrate complete tendon discontinuity with fluid filling the gap. The supraspinatus tendon, most commonly affected, should be carefully evaluated from its musculotendinous junction to its footprint insertion on the greater tuberosity.

Critical measurements in rotator cuff tear characterization include anterior-posterior dimension, medial-lateral retraction, and cross-sectional area involvement. Massive rotator cuff tears involving two or more tendons significantly impact surgical approach and repair technique. Concomitant findings including acromial morphology, acromioclavicular joint arthropathy, and subacromial spurs contribute to extrinsic impingement and should be documented. Muscle atrophy and fatty infiltration, best appreciated on sagittal T1-weighted images, represent important prognostic factors that influence repair outcomes and recovery potential.

Rotator cuff pathology grading system:

  • Grade 0: Normal tendon
  • Grade 1: Tendinosis (increased signal without discontinuity)
  • Grade 2: Partial-thickness tear (<50% tendon thickness)
  • Grade 3: Partial-thickness tear (>50% tendon thickness)
  • Grade 4: Full-thickness tear (complete discontinuity)

What Do Labral Tears Look Like on Shoulder MRI?

The glenoid labrum, a fibrocartilaginous structure that deepens the glenoid socket, demonstrates variable normal anatomy that must be distinguished from pathological tearing. The anterior labrum typically appears sharply triangular with low signal intensity, while the posterior labrum may be more rounded. Labral tears manifest as linear fluid signal extending into or through the labral substance, labral fragmentation, or complete detachment from the glenoid rim. MR arthrography significantly improves sensitivity for detecting labral pathology by distending the joint and outlining subtle undersurface tears.

Superior labral anterior-posterior (SLAP) tears extend from anterior to posterior through the biceps anchor, with multiple subtypes having distinct surgical implications. Bankart lesions representing anterior inferior labral detachment occur following anterior dislocation and may include bony fragments. Posterior labral tears, less common than anterior variants, often associate with posterior instability or internal impingement in overhead athletes. The paralabral cyst, a common finding associated with labral tears, may cause nerve compression and requires description of size and location.

Classification of labral pathology:

  • SLAP tears (Types I-IV with extensions)
  • Bankart lesions (soft tissue and bony variants)
  • Posterior labral tears (reverse Bankart)
  • ALPSA lesions (anterior labroligamentous periosteal sleeve avulsion)
  • GLAD lesions (glenolabral articular disruption)
  • HAGL lesions (humeral avulsion of glenohumeral ligament)

How Are Biceps Tendon and Pulley Injuries Evaluated?

The long head of biceps tendon courses through the bicipital groove within a synovial sheath, stabilized by the biceps pulley comprising coracohumeral ligament, superior glenohumeral ligament, and rotator cuff contributions. Biceps tendinosis appears as thickened tendon with intermediate signal, while partial tears demonstrate fluid signal within the tendon substance. Medial subluxation or dislocation occurs with pulley insufficiency, often associated with subscapularis tearing. Complete biceps rupture typically occurs at the proximal insertion with retraction of the muscle belly distally.

The biceps labral complex represents a critical anatomical and functional unit where pathology frequently coexists. SLAP tears commonly extend to involve the biceps anchor, while rotator cuff tears frequently associate with biceps tendinopathy or instability. Isolated biceps tendonitis may respond to conservative treatment, while pulley injuries with subluxation often require surgical stabilization. The hourglass biceps, a condition where the intra-articular portion becomes enlarged and constricted, causes mechanical symptoms and typically requires tenotomy or tenodesis.

Biceps tendon pathology spectrum:

  • Tenosynovitis (fluid in sheath with normal tendon)
  • Tendinosis (thickening with increased signal)
  • Partial tear (fluid signal within tendon)
  • Subluxation (medial displacement from groove)
  • Dislocation (complete medial displacement)
  • Rupture (complete discontinuity with retraction)

What Is the Significance of Bone Marrow Edema in Shoulder MRI?

Bone marrow edema appears as ill-defined areas of increased T2 signal within the trabecular bone, representing microtrabecular injury, inflammation, or vascular congestion. In the setting of acute trauma, bone marrow edema may indicate occult fracture or contusion pattern that correlates with mechanism. Posterosuperior humeral head edema in overhead athletes suggests internal impingement with repetitive contact between rotator cuff and glenoid rim. Extensive humeral head edema following dislocation raises concern for associated Hill-Sachs lesion or osteochondral injury.

Diffuse bone marrow edema throughout the humeral head, particularly in middle-aged patients, may represent transient osteoporosis of the shoulder, a self-limiting condition that resolves over several months. Persistent focal edema should raise suspicion for avascular necrosis, especially in the presence of risk factors including corticosteroid use, alcohol abuse, or sickle cell disease. Subchondral cyst formation and collapse indicate advanced avascular necrosis requiring surgical intervention. Inflammatory arthritis typically demonstrates periarticular edema with synovitis and erosions.

Causes of bone marrow edema on shoulder MRI:

  • Trauma (contusion, occult fracture)
  • Instability (Hill-Sachs, engaging lesions)
  • Impingement (internal, subacromial)
  • Osteonecrosis (avascular necrosis)
  • Transient osteoporosis (self-resolving)
  • Inflammatory arthritis (rheumatoid, spondyloarthritis)
  • Infection (osteomyelitis)

How Does Cartilage Assessment Impact Treatment Decisions?

Articular cartilage evaluation focuses on the humeral head and glenoid surfaces, grading thickness, signal characteristics, and surface integrity. Normal hyaline cartilage demonstrates intermediate signal on proton density and T2-weighted sequences with smooth surfaces and uniform thickness. Cartilage loss progresses from surface fibrillation to partial-thickness defects, full-thickness defects with exposed bone, and eventually bone-on-bone appearance in advanced osteoarthritis. The posterior superior humeral head represents a common location for cartilage wear in overhead athletes due to internal impingement.

Outerbridge classification provides a standardized system for cartilage assessment, though MRI tends to underestimate cartilage damage compared to arthroscopy. Cartilage lesions measuring greater than 2 cm² or involving weight-bearing surfaces significantly impact surgical decision-making, potentially necessitating restorative procedures including microfracture, osteochondral autograft, or allograft transplantation. Diffuse cartilage loss with osteophyte formation, subchondral cysts, and joint space narrowing indicates advanced osteoarthritis, potentially requiring shoulder arthroplasty in symptomatic patients.

Cartilage pathology grading system:

  • Grade 0: Normal cartilage
  • Grade 1: Cartilage softening and swelling
  • Grade 2: Partial-thickness defect <50%
  • Grade 3: Partial-thickness defect >50%
  • Grade 4: Full-thickness defect with exposed bone

What Are the Key MRI Findings in Shoulder Instability?

Shoulder instability encompasses a spectrum of pathological conditions resulting from traumatic dislocation, repetitive microtrauma, or inherent ligamentous laxity. Anterior instability, representing 90% of cases, demonstrates characteristic findings including Bankart lesion (anterior inferior labral tear), Hill-Sachs impaction fracture (posterosuperior humeral head), and injury to the inferior glenohumeral ligament complex. The bipolar lesion concept recognizes that both glenoid and humeral head pathology contribute to recurrent instability and must be addressed during surgical stabilization.

Posterior instability, though less common, presents distinct MRI findings including reverse Bankart lesion (posterior labral tear), reverse Hill-Sachs lesion (anterosuperior humeral head impaction), and posterior capsular injury. Multidirectional instability typically demonstrates patulous capsule without discrete labral tearing, though associated rotator interval lesions may be present. The glenoid track concept has revolutionized understanding of engaging Hill-Sachs lesions, where medial displacement of the defect beyond the glenoid rim during abduction-external rotation predisposes to recurrent dislocation.

Instability-related MRI findings:

  • Bankart lesion (anteroinferior labral tear)
  • Hill-Sachs lesion (posterosuperior humeral impaction)
  • ALPSA lesion (medially displaced labral tear)
  • HAGL lesion (humeral avulsion glenohumeral ligament)
  • GLAD lesion (glenolabral articular disruption)
  • Rotator interval injury (SGHL/CHL complex)
  • Bone loss (glenoid rim, humeral head)

How to Assess Acromioclavicular Joint Pathology on MRI

The acromioclavicular (AC) joint represents a common source of shoulder pain, with MRI providing excellent visualization of articular surfaces, capsule, and supporting ligaments. AC joint osteoarthritis manifests as joint space narrowing, osteophyte formation, subchondral cysts, and bone marrow edema, often with associated synovitis and joint effusion. Distal clavicular osteolysis, typically seen in weightlifters, demonstrates bone marrow edema, cortical irregularity, and resorption of the distal clavicle. AC joint separation injuries are graded based on ligamentous involvement and displacement.

The coracoclavicular ligaments (trapezoid and conoid) provide vertical stability, while the acromioclavicular ligaments maintain horizontal stability. Type I AC joint sprains demonstrate ligament sprain without widening, Type II injuries include AC ligament rupture with CC ligament sprain, while Type III-VI injuries represent progressively severe displacement with complete ligament disruption. AC joint arthrosis frequently associates with subacromial spurs and rotator cuff pathology through extrinsic impingement mechanisms. Cystic changes in the distal clavicle may indicate intraosseous ganglion or degenerative cysts.

AC joint pathology classification:

  • Osteoarthritis (joint space narrowing, osteophytes)
  • Distal clavicular osteolysis (edema, resorption)
  • AC joint separation (Types I-VI)
  • Synovitis and inflammatory arthritis
  • Geodes (subchondral cysts)
  • Post-traumatic osteolysis

What Is the Role of MR Neurography in Shoulder Evaluation?

MR neurography utilizes specialized sequences with fat suppression and high spatial resolution to directly visualize peripheral nerves, detecting signal abnormalities, caliber changes, and perineural fibrosis. The brachial plexus and its terminal branches including suprascapular, axillary, and musculocutaneous nerves are susceptible to compression, traction, or direct injury. Suprascapular neuropathy, a common cause of shoulder pain and weakness, may result from spinoglenoid or suprascapular notch compression by ganglia, labral cysts, or ligamentous structures.

Quadrilateral space syndrome involves axillary nerve compression by fibrous bands or hypertrophy, causing deltoid weakness and lateral shoulder numbness. Parsonage-Turner syndrome (neuralgic amyotrophy) demonstrates patchy, multifocal nerve involvement with acute onset pain followed by weakness and muscle denervation changes. Postsurgical neuromas may develop following shoulder procedures, causing persistent pain. Nerve injuries significantly impact functional outcomes and require precise diagnosis to guide management, which may include surgical decompression, neurologis, or nerve transfer procedures.

Common neuropathic conditions affecting the shoulder:

  • Suprascapular neuropathy (notch and spinoglenoid)
  • Axillary neuropathy (quadrilateral space syndrome)
  • Brachial neuritis (Parsonage-Turner syndrome)
  • Long thoracic neuropathy (scapular winging)
  • Spinal accessory neuropathy (trapezius weakness)
  • Postsurgical nerve injury

How to Correlate MRI Findings with Clinical Symptoms

Effective shoulder management requires careful correlation between imaging findings and clinical presentation, as not all MRI abnormalities are symptomatic. Rotator cuff tears increase in prevalence with age, with studies demonstrating full-thickness tears in 25% of individuals over 60 and 50% over 70 years, many of whom remain asymptomatic. Factors suggesting symptomatic tears include acute extension of chronic tear, significant weakness on examination, night pain, and functional limitation. Clinical tests including empty can, lift-off, and belly-press help isolate specific rotator cuff muscles and correlate with MRI findings.

Labral tears may cause mechanical symptoms including catching, locking, or popping, particularly with overhead activities. The O'Brien test, crank test, and anterior apprehension help identify symptomatic labral pathology. Biceps tendon disorders typically present with anterior shoulder pain localized to the bicipital groove, exacerbated by lifting and resisted forearm supination. Instability symptoms include apprehension with arm abduction and external rotation, while impingement syndrome demonstrates painful arc between 60-120 degrees of abduction. Patient age, activity level, and occupational demands significantly influence treatment decisions regardless of MRI findings.

Clinical correlation guidelines:

  • Rotator cuff tears: Correlate weakness, atrophy, functional loss
  • Labral tears: Mechanical symptoms, instability, overhead pain
  • Biceps pathology: Anterior groove pain, Speed's test
  • Instability: Apprehension, relocation test, history of dislocation
  • AC joint pathology: Cross-body adduction test, localized tenderness
  • Arthritis: Creptius, global stiffness, night pain

What Are the Treatment Options Based on Shoulder MRI Findings?

Treatment decisions integrate MRI findings with clinical symptoms, patient factors, and functional requirements. Asymptomatic rotator cuff tears typically warrant observation, while symptomatic tears may respond to physical therapy, subacromial injection, or surgical repair based on tear characteristics, muscle quality, and patient age. Partial-thickness tears involving less than 50% tendon thickness often respond to debridement and subacromial decompression, while higher-grade partial tears and full-thickness tears in active patients typically require repair.

SLAP tears present complex decision-making, with Type I and III lesions often managed with debridement, while Type II repairs demonstrate variable outcomes, particularly in older patients. Biceps tenodesis provides reliable alternative to SLAP repair with potentially superior outcomes. Instability management depends on bone loss, with engaging Hill-Sachs lesions or significant glenoid deficiency requiring bony procedures including Latarjet, while soft tissue Bankart repairs suffice for minimal bone loss. Advanced osteoarthritis with concentric joint space loss responds well to anatomic or reverse total shoulder arthroplasty based on rotator cuff status.

Treatment algorithm based on MRI findings:

  • Rotator cuff tendinosis: Physical therapy, activity modification
  • Partial-thickness tears <50%: Debridement, decompression
  • Partial-thickness tears >50%: Transtendon repair
  • Full-thickness tears: Arthroscopic or open repair
  • Massive irreparable tears: Superior capsule reconstruction, reverse arthroplasty
  • SLAP tears: Debridement, repair, or biceps tenodesis
  • Instability: Bankart repair, Latarjet, remplissage
  • Osteoarthritis: Arthroplasty (anatomic or reverse)

How Does Rehabilitation Protocol Depend on MRI Findings?

Postoperative rehabilitation protocols must be individualized based on surgical procedure, tissue quality, and specific pathology addressed. Rotator cuff repair rehabilitation progresses through protection, active assistance, and strengthening phases, with timeline variations based on tear size, repair security, and tissue quality. Small tears with good tissue may advance more rapidly, while massive repairs with marginal tissue require slower progression with longer protection. Labral repair rehabilitation emphasizes early range of motion within safe zones while protecting the healing capsulolabral complex.

Instability repairs typically involve longer immobilization to permit solid healing before initiating progressive motion. Superior capsule reconstruction requires particularly cautious advancement due to allograft incorporation demands. Reverse total shoulder arthroplasty permits early active motion due to inherent stability of the prosthesis design. Rehabilitation adherence significantly influences outcomes, with supervised physical therapy demonstrating superior results compared to home programs alone. Patient-specific factors including age, comorbidities, and smoking status impact healing potential and protocol modifications.

Rehabilitation phases based on pathology:

  • Protection phase (0-6 weeks): Immobilization, pendulum exercises
  • Active motion phase (6-12 weeks): Progressive range of motion
  • Strengthening phase (3-6 months): Resistance training, proprioception
  • Advanced training phase (6-9 months): Sport-specific drills
  • Return to activity (9-12 months): Gradual return to sports

What Are the Limitations and Pitfalls in Shoulder MRI Interpretation?

Shoulder MRI interpretation requires awareness of numerous potential pitfalls that may lead to misdiagnosis. Anatomical variants including Buford complex (absent anterosuperior labrum with cord-like middle glenohumeral ligament), sublabral foramen (anterosuperior labral detachment), and articular cartilage undercutting the labral base may mimic pathology. Magic angle phenomenon occurring at 55 degrees to the magnetic field causes artifactual increased signal in tendons on short TE sequences, potentially mimicking tendinosis or partial tearing.

Partial volume averaging, particularly at the rotator cuff insertion, may create false appearance of tearing when imaging slices intersect the curved tendon obliquely. Susceptibility artifacts from prior surgery, including suture anchors and metallic debris, degrade image quality and may obscure pathology. The rotator cuff interval demonstrates normal fat signal that should not be mistaken for pathology. Asymptomatic findings including acromial spurs, AC joint arthrosis, and labral degeneration increase with age and must be correlated with clinical symptoms to determine significance.

Common interpretive pitfalls:

  • Anatomical variants mimicking pathology
  • Magic angle artifact in tendons
  • Partial volume averaging at insertions
  • Postoperative artifacts from hardware
  • Age-related changes misinterpreted as significant
  • Asymptomatic findings overtreated
  • Incomplete clinical correlation

How to Use the Shoulder MRI Results Interpreter Calculator

Our Shoulder MRI Results Interpreter Calculator integrates imaging findings, clinical symptoms, and patient factors to generate personalized assessment and treatment recommendations. The calculator processes inputs including rotator cuff status, labral pathology, biceps tendon condition, cartilage assessment, and functional limitations through validated algorithms based on current orthopedic literature and clinical guidelines. The resulting severity score, color-coded risk assessment, and specific recommendations help patients and providers understand the implications of MRI findings and guide subsequent management decisions.

The calculator incorporates prognostic factors including patient age, activity level, symptom duration, and prior treatments to contextualize imaging findings. The interactive interface allows adjustment of inputs to model different scenarios and treatment approaches. The downloadable PDF report organizes findings in standardized format suitable for specialist consultation and medical records. This tool serves as an educational resource to enhance patient understanding and facilitate shared decision-making regarding treatment options ranging from conservative management to surgical intervention.

Calculator input categories:

  • Patient demographics and medical history
  • Rotator cuff tendon status and muscle quality
  • Labral and biceps tendon pathology
  • Cartilage and bone marrow findings
  • Symptom characteristics and functional impact
  • Prior treatments and response
  • Activity requirements and goals

Understanding Your Shoulder MRI Calculator Results

The Shoulder MRI Calculator generates a comprehensive report including severity score, risk stratification, interpretation, and personalized recommendations. The severity score ranges from 0-100, with higher scores indicating more significant pathology requiring intervention. Scores below 25 typically correspond to minimal changes amenable to conservative management, while scores above 50 often indicate advanced pathology potentially requiring surgical consideration. The color-coded risk meter provides visual representation of pathology severity, with green indicating minimal, yellow moderate, and red severe pathology requiring prompt attention.

The interpretation section explains the clinical significance of your specific MRI findings in context of your symptoms and functional limitations. This includes prognosis, expected natural history, and potential for progression without intervention. The recommendations section provides specific guidance regarding conservative treatments, interventional procedures, surgical options, and rehabilitation protocols tailored to your individual profile. Activity modifications, work restrictions, and return-to-sport timelines help manage expectations and facilitate recovery.

Result components explained:

  • Severity score (0-100 scale with interpretation)
  • Risk stratification (color-coded visual meter)
  • Clinical correlation (symptom explanation)
  • Treatment recommendations (conservative to surgical)
  • Prognostic information (expected outcomes)
  • Activity guidance (modifications, restrictions)
  • Follow-up recommendations (timing, indications)

Frequently Asked Questions About Shoulder MRI

What is the accuracy of shoulder MRI for detecting rotator cuff tears?
Shoulder MRI demonstrates 85-95% sensitivity and 90-95% specificity for full-thickness rotator cuff tears, with slightly lower accuracy for partial-thickness tears. MR arthrography improves detection of partial articular-sided tears and labral pathology. Accuracy varies based on magnet strength, imaging protocol, and radiologist experience.

Can shoulder MRI distinguish between old and new rotator cuff tears?
MRI findings suggesting acute tearing include tendon retraction, muscle edema, fluid-filled gap, and associated bone marrow edema. Chronic tears demonstrate tendon retraction with fatty infiltration, muscle atrophy, and absence of edema. However, acute extension of chronic tears may show mixed features requiring clinical correlation.

What shoulder MRI findings require surgical intervention?
Surgical consideration typically includes full-thickness rotator cuff tears in young patients, massive tears with progressive weakness, engaging Hill-Sachs lesions, significant glenoid bone loss, large unstable SLAP tears, biceps tendon dislocation with subscapularis tear, and advanced osteoarthritis unresponsive to conservative measures.

How long does it take to get shoulder MRI results?
Standard shoulder MRI protocols require 30-45 minutes scanning time. Interpretation typically adds 24-48 hours for finalized radiology report, though emergent findings may be communicated immediately. The complete process from ordering to final report usually takes 3-7 days depending on facility scheduling and workflow.

What is the difference between conventional MRI and MR arthrography for shoulder?
Conventional MRI utilizes natural tissue contrast, while MR arthrography involves injection of gadolinium contrast into the joint space to distend the capsule and outline structures. MR arthrography significantly improves detection of labral tears, partial rotator cuff tears, and capsular injuries, particularly in postoperative shoulders and instability evaluation.

Does shoulder MRI show nerve compression or damage?
Standard shoulder MRI protocols demonstrate gross nerve abnormalities and secondary muscle denervation changes. Dedicated MR neurography protocols with specialized sequences provide superior nerve visualization, detecting signal abnormalities, caliber changes, and perineural fibrosis that indicate compression or injury.

What should I do if my shoulder MRI shows incidental findings?
Incidental findings including benign cysts, asymptomatic labral degeneration, and age-appropriate rotator cuff changes are common. Significant incidental findings requiring further evaluation may include bone lesions, mass lesions, or unexpected infection. Discuss any incidental findings with your referring physician for appropriate follow-up recommendations.

Disclaimer: This educational content provides general information only and does not constitute medical advice. Always consult qualified healthcare providers for diagnosis and treatment decisions. The calculator offers estimates based on provided information and should not replace professional medical evaluation.

Double-Marker-Test-First-Trimester-Pregnancy-Screening

Double Marker Test: First Trimester Pregnancy Screening

The double marker test is a crucial first-trimester screening that assesses the risk of chromosomal abnormalities in the developing fetus. This non-invasive blood test, combined with an ultrasound examination, provides early insights into the baby’s health and development. Our comprehensive guide covers everything from test procedure and result interpretation to the latest advancements in prenatal screening, helping expectant parents make informed decisions about their pregnancy journey.

In this complete guide, you will learn:

🔍 What the double marker test detects and why it matters
📊 How to interpret your test results and risk ratios
🩺 When and how the screening is performed
📈 Accuracy rates and limitations of the test
🆚 How it compares to other prenatal screening options
💡 Latest advancements in first-trimester screening
📋 What to do after receiving your results
🔄 How it fits into comprehensive prenatal care

Pregnancy Due Date Calculator | Doseway

Pregnancy Due Date Calculator

Calculate your estimated due date and track your pregnancy progress

1. Demographics
2. Medical History
3. Pregnancy Details
4. Results

Personal Information

cm
ft/in
kg
lbs

Medical History

Hold Ctrl/Cmd to select multiple options
/ mmHg

Pregnancy Information

Your Pregnancy Due Date Calculation

Estimated Due Date

Calculating…

Based on your last menstrual period

Your Pregnancy Progress

You are approximately 0 weeks and 0 days pregnant

1st Trimester

Weeks 1-13

2nd Trimester

Weeks 14-27

3rd Trimester

Weeks 28-40+

Key Dates in Your Pregnancy

    Disclaimer: This calculator provides estimated dates only. Always consult with your healthcare provider for accurate pregnancy dating and prenatal care. The results from this tool should not be considered medical advice.

    © Doseway Pregnancy Due Date Calculator | https://doseway.com/ | Email: support@doseway.com | WhatsApp: +92318-6144650

    Try More Free Tools:

    Free-Double-Marker-Test-First-Trimester-Pregnancy-Screening

    What is the Double Marker Test in Pregnancy Screening?

    The double marker test, also known as the first-trimester combined screening, is a prenatal blood test that measures two specific pregnancy-associated substances: Pregnancy-Associated Plasma Protein-A (PAPP-A) and free beta-human Chorionic Gonadotropin (free β-hCG). This screening is typically performed between 11 weeks and 13 weeks 6 days of pregnancy, ideally coordinated with a nuchal translucency ultrasound scan. The test doesn’t diagnose conditions directly but calculates the statistical probability of the fetus having certain chromosomal abnormalities, primarily Down syndrome (trisomy 21), Edwards syndrome (trisomy 18), and Patau syndrome (trisomy 13).

    The double marker test represents a significant advancement in non-invasive prenatal testing because it provides early detection capabilities without risking pregnancy loss. Unlike diagnostic tests such as amniocentesis or chorionic villus sampling, the double marker test poses no physical risk to the fetus since it only requires a blood sample from the mother. The screening incorporates multiple factors including the blood markers, nuchal translucency measurement, maternal age, weight, ethnicity, and gestational age to generate a personalized risk assessment. This comprehensive approach significantly improves detection rates compared to maternal age-based risk assessment alone, which only identifies about 30% of Down syndrome cases, while the combined first-trimester screening detects approximately 85-90% of cases with a 5% false-positive rate.

    Key aspects of the double marker test:

    🎯 Screening Purpose: Assesses risk for chromosomal abnormalities
    ⏰ Optimal Timing: 11-13+6 weeks gestation
    🩸 Sample Collection: Simple blood draw from mother
    📊 Risk Calculation: Combines multiple factors for accuracy
    🛡️ Safety Profile: Non-invasive with no procedure-related miscarriage risk
    🔢 Detection Rate: 85-90% for Down syndrome with 5% false positives

    How Does the Double Marker Test Work biologically?

    The double marker test functions by measuring specific biochemical markers that reflect placental function and fetal development. Pregnancy-Associated Plasma Protein-A (PAPP-A) is a protein produced by the placenta that increases throughout pregnancy, with lower levels in the first trimester associated with an increased risk of chromosomal abnormalities. Free beta-human Chorionic Gonadotropin (free β-hCG) is a hormone produced during pregnancy, with elevated levels in the first trimester potentially indicating higher risk for Down syndrome. These biochemical markers, when analyzed in conjunction with ultrasound findings and maternal factors, create a sophisticated risk assessment algorithm that identifies pregnancies that may benefit from further diagnostic testing.

    The biological basis for the test relies on the relationship between these markers and fetal chromosomal status. In pregnancies with Down syndrome, PAPP-A levels tend to be lower while free β-hCG levels are typically higher compared to chromosomally normal pregnancies. For Edwards syndrome (trisomy 18) and Patau syndrome (trisomy 13), both markers are generally decreased. The nuchal translucency measurement, which assesses the fluid-filled space at the back of the fetal neck, provides additional information as increased thickness is associated with chromosomal abnormalities and certain structural defects. The combination of these parameters creates a multidimensional assessment that significantly outperforms single-marker screening.

    Biological mechanisms behind marker variations:

    🧬 Placental Function: Markers reflect placental health and development
    📉 PAPP-A Significance: Low levels suggest impaired early placental development
    📈 hCG Patterns: Abnormal levels indicate potential chromosomal issues
    🔍 NT Ultrasound: Measures fetal fluid collection related to cardiac function
    ⚖️ Hormonal Balance: Marker patterns differ by specific chromosomal condition
    🔄 Gestational Changes: Marker levels change throughout pregnancy

    When Should You Get the Double Marker Test During Pregnancy?

    The double marker test has a specific gestational window for optimal accuracy, typically scheduled between 11 weeks 0 days and 13 weeks 6 days of pregnancy, with the ideal timing around 12 weeks. This precise timeframe is critical because the biochemical markers and nuchal translucency measurement have specific patterns during this developmental period that provide the most accurate risk assessment. The test timing is usually calculated from the first day of the last menstrual period (LMP) or, more accurately, based on crown-rump length measurements from an early ultrasound, which is why our pregnancy due date calculator becomes an essential tool for determining the correct testing window.

    Scheduling the double marker test requires careful pregnancy dating, as the interpretation of results depends heavily on accurate gestational age assessment. The nuchal translucency measurement particularly requires precise timing because the normal range changes rapidly as the pregnancy progresses, and the measurement is only valid within this specific window. Many healthcare providers recommend having the blood draw performed a few days before the scheduled ultrasound to allow the laboratory sufficient time to process the results, which can then be integrated with the ultrasound findings for a comprehensive risk assessment. For women with irregular menstrual cycles or uncertain dates, an early dating ultrasound is essential before undergoing the double marker test.

    Testing timeline considerations:

    🗓️ Gestational Window: 11 weeks 0 days to 13 weeks 6 days
    ⏱️ Ideal Timing: Approximately 12 weeks gestation
    📅 Scheduling: Blood test often done before NT ultrasound
    🔢 Dating Critical: Accuracy depends on correct gestational age
    🔄 Sequence: Blood draw → NT ultrasound → combined risk calculation
    ⚡ Processing Time: Results typically available within 1-2 weeks

    What Does the Double Marker Test Screen For Specifically?

    The double marker test primarily screens for the most common autosomal trisomies, which are chromosomal conditions caused by an extra copy of a particular chromosome. Down syndrome (trisomy 21) is the most frequently screened condition, characterized by an extra chromosome 21 that causes intellectual disability, distinctive physical features, and increased risk for certain health issues including heart defects and thyroid problems. Edwards syndrome (trisomy 18) involves an extra chromosome 18 and is associated with severe intellectual disability and multiple organ system abnormalities, with most affected infants not surviving beyond the first year. Patau syndrome (trisomy 13) results from an extra chromosome 13 and causes severe intellectual disability, physical abnormalities, and very low survival rates beyond the first year.

    While the primary focus is on these three trisomies, the double marker test components can also provide indications of other pregnancy complications. Abnormal levels of the biochemical markers, particularly very low PAPP-A, have been associated with an increased risk of adverse pregnancy outcomes such as preeclampsia, fetal growth restriction, and stillbirth, even when chromosomal abnormalities are not present. The nuchal translucency measurement can identify fetuses at increased risk for cardiac defects and other structural abnormalities. Some laboratories also report risks for triploidy (a condition with an entire extra set of chromosomes) and Smith-Lemli-Opitz syndrome based on the marker patterns, though these are less common screening targets.

    Conditions detected through screening:

    🧬 Down Syndrome: Trisomy 21 – most common chromosomal abnormality
    🧬 Edwards Syndrome: Trisomy 18 – severe multiple anomalies
    🧬 Patau Syndrome: Trisomy 13 – severe neurological and physical defects
    ❤️ Cardiac Defects: Suggested by increased nuchal translucency
    👶 Growth Issues: Associated with abnormal biochemical markers
    ⚠️ Pregnancy Complications: Link to preeclampsia and stillbirth risk

    How Accurate is the Double Marker Test in Detecting Abnormalities?

    The double marker test, when combined with nuchal translucency ultrasound (forming the first-trimester combined screening), demonstrates a detection rate of approximately 85-90% for Down syndrome with a false-positive rate of about 5%. For Edwards syndrome and Patau syndrome, the detection rate is somewhat higher, around 95%, though these conditions are much rarer. The term “detection rate” refers to the percentage of affected pregnancies that are correctly identified as high-risk, while “false-positive rate” indicates the percentage of normal pregnancies mistakenly flagged as high-risk. These performance statistics represent significant improvements over second-trimester maternal serum screening alone, which detects about 75-80% of Down syndrome cases with a similar false-positive rate.

    The accuracy of the double marker test is influenced by several factors including maternal age, gestational age at testing, the precision of the ultrasound measurements, and laboratory quality control. For women under 35, the test is particularly valuable as it provides personalized risk assessment beyond age-based statistics alone. The test performance is highest when performed at the optimal gestational age and when the nuchal translucency measurement is obtained by a certified sonographer using standardized techniques. It’s important to understand that the double marker test is a screening tool, not a diagnostic test, meaning it assesses probability rather than providing definitive answers about the fetal chromosomal status.

    Accuracy metrics by condition:

    📊 Down Syndrome: 85-90% detection with 5% false positives
    📊 Edwards Syndrome: 95% detection rate
    📊 Patau Syndrome: 95% detection rate
    🎯 Combined Screening: Superior to second-trimester screening alone
    📈 Age Factor: Performance varies with maternal age
    🔧 Technical Factors: Ultrasound quality impacts accuracy

    What Do Double Marker Test Results Mean and How to Interpret Them?

    Double marker test results are typically reported as a risk score or probability ratio rather than a simple positive or negative outcome. Common formats include “1 in X” risk (e.g., 1 in 1,000) for Down syndrome, Edwards syndrome, and Patau syndrome, with laboratory-specific cutoff values determining what constitutes a “screen positive” result. Most laboratories use a cutoff risk of 1 in 250 to 1 in 300 for Down syndrome, meaning that if the calculated risk is greater than this threshold (e.g., 1 in 200), the result is considered screen positive and further diagnostic testing is recommended. The results also typically include the multiple of the median (MoM) values for each biochemical marker, which represent how the patient’s levels compare to the median value for unaffected pregnancies at the same gestational age.

    Interpreting double marker test results requires understanding that a screen positive result does not mean the fetus definitely has a chromosomal abnormality, but rather that the risk is sufficiently high to warrant diagnostic testing. Similarly, a screen negative result doesn’t guarantee a chromosomally normal fetus, but indicates that the risk is low enough that invasive diagnostic procedures are not routinely recommended. The specific numerical risk should be considered in context – for example, a 35-year-old woman with a 1 in 400 risk result has a lower personal risk than her age-related background risk of approximately 1 in 250. Healthcare providers should explain these nuances and provide appropriate counseling based on the individual’s results and circumstances.

    Result interpretation guidelines:

    🔢 Risk Format: Typically presented as “1 in X” probability
    🎚️ Cutoff Values: Usually 1/250 to 1/300 for screen positive
    📋 MoM Values: Multiple of median for each biomarker
    ✅ Screen Negative: Low probability, no further action typically needed
    🔄 Screen Positive: Increased probability, diagnostic testing recommended
    📉 Very High Risk: Extreme marker abnormalities may suggest other issues

    Double Marker Test vs NIPT: Which First Trimester Screening is Better?

    The comparison between double marker test (as part of first-trimester combined screening) and non-invasive prenatal testing (NIPT) represents a significant decision point in modern prenatal care. NIPT, which analyzes cell-free fetal DNA in maternal blood, boasts higher detection rates for common trisomies (99% for Down syndrome) with lower false-positive rates (0.1-0.3%) compared to the double marker test. However, the double marker test provides additional information beyond chromosomal assessment, including the nuchal translucency measurement that can identify structural abnormalities and risk for other pregnancy complications, while also being significantly less expensive than NIPT in most healthcare settings.

    For standard-risk pregnancies, professional guidelines vary regarding which screening approach to recommend first. The double marker test with NT ultrasound remains the standard first-line screening in many public healthcare systems due to its cost-effectiveness and additional structural assessment capabilities. NIPT is often recommended as a secondary test following positive double marker results or as a primary screen for women at increased risk. Some providers now offer contingent screening models where all women receive double marker testing with NT ultrasound, and only those with intermediate risk results proceed to NIPT, while high-risk results go directly to diagnostic testing. This approach aims to balance detection rates, false positives, and overall costs.

    Comparison of screening methods:

    FeatureDouble Marker TestNIPT
    Detection Rate (Down Syndrome)85-90%99%
    False Positive Rate5%0.1-0.3%
    Conditions ScreenedTrisomy 21,18,13 + structural cluesTrisomy 21,18,13 + sex chromosomes
    NT Ultrasound IncludedYesNo (separate if needed)
    CostLowerHigher
    Gestational Age11-14 weeksFrom 10 weeks

    What is the Procedure for Double Marker Test Blood Work?

    The double marker test blood collection procedure is straightforward and identical to routine blood draws, requiring no special preparation such as fasting. Typically, 5-10 mL of blood is collected from a vein in the arm into a specialized serum tube, which is then centrifuged to separate the serum from blood cells. The serum sample is transported to a laboratory where automated immunoassay systems measure the concentrations of PAPP-A and free β-hCG. The analysis must be performed in a certified laboratory with appropriate quality control measures, as the accuracy of the risk calculation depends heavily on precise measurement of these biomarkers.

    The blood sample stability and processing timeline are important considerations, as the biomarkers can degrade if not handled properly. Most laboratories require that samples be processed within a specific timeframe after collection, typically within 24-48 hours, and may reject samples that show signs of hemolysis or improper storage. The entire process from blood draw to result availability generally takes 7-14 days, though this varies by laboratory and healthcare system. Some facilities offer integrated screening where the first-trimester blood work is combined with second-trimester biomarkers to generate a single risk assessment with even higher detection rates, though this delays final results until the second trimester.

    Blood test procedure details:

    💉 Sample Collection: Standard venipuncture from arm
    🧪 Tube Type: Special serum separator tube
    ⚗️ Laboratory Analysis: Automated immunoassay systems
    ⏱️ Processing Time: 7-14 days for results
    📦 Sample Transport: Temperature-controlled shipping often required
    🔬 Quality Control: Certified laboratories essential for accuracy

    How Much Does the Double Marker Test Cost with and without Insurance?

    The double marker test cost varies significantly based on geographic location, healthcare setting, and insurance coverage, with typical self-pay prices ranging from $150 to $400 in the United States. When the test is combined with the nuchal translucency ultrasound, the total cost for first-trimester combined screening may range from $300 to $800 without insurance coverage. Many insurance plans, including Medicaid in some states, cover prenatal genetic screening tests like the double marker test, particularly for women over 35 or with other risk factors, though copays and deductibles still apply. Patients should verify coverage with their insurance provider beforehand, as some plans may require preauthorization or have specific network restrictions for laboratories and imaging facilities.

    For women without insurance coverage or with high deductible plans, several cost-reduction options may be available. Some laboratory companies offer cash-pay discounts or sliding scale fees based on income, while certain community health programs provide subsidized prenatal screening services. In countries with public healthcare systems, the double marker test is often provided at no direct cost to patients as part of routine prenatal care. When considering cost, it’s important to weigh the value of the information provided against the expense, as early detection of chromosomal abnormalities can significantly impact pregnancy management decisions and preparation for a child with special needs.

    Cost considerations:

    💰 Self-Pay Range: $150-400 for blood test alone
    💵 With NT Ultrasound: $300-800 total
    🏥 Insurance Coverage: Often covered, especially for higher-risk pregnancies
    📋 Preauthorization: Sometimes required by insurance
    🎯 Financial Assistance: Available through some laboratories and programs
    🌍 International Variances: Cost structures differ by country

    What Factors Affect Double Marker Test Results Accuracy?

    Several biological and technical factors can influence double marker test results, potentially affecting the accuracy of risk assessment. Maternal weight significantly impacts biomarker concentrations, as higher blood volume in heavier women dilutes the pregnancy-associated proteins, potentially leading to falsely low levels that could increase risk scores. Laboratories apply weight adjustment algorithms to correct for this effect, but extreme weights may still compromise accuracy. Assisted reproductive technologies, particularly IVF with donor eggs, can alter biomarker patterns since PAPP-A production is influenced by the immunological relationship between mother and fetus, requiring specialized risk calculation methods in these cases.

    Multiple pregnancies present particular challenges for double marker test interpretation, as each fetus contributes to the biomarker levels in maternal blood. While screening is possible in twin pregnancies, the risk calculation is more complex and detection rates are somewhat lower, especially for dichorionic twins. Smoking status affects biomarker levels, with smokers typically having lower PAPP-A and higher hCG values, which most laboratories account for in their algorithms. Maternal medical conditions such as insulin-dependent diabetes can also influence results, potentially requiring adjusted interpretation. Even the ethnicity of the mother can slightly affect the normal ranges for biomarkers, though contemporary screening algorithms typically incorporate ethnicity-specific medians.

    Factors affecting test accuracy:

    ⚖️ Maternal Weight: Higher weight dilutes biomarkers
    👶 Multiple Pregnancy: Each fetus contributes to biomarker levels
    🚬 Smoking Status: Alters normal biomarker ranges
    🩺 Diabetes: Insulin-dependent diabetes affects results
    🧬 IVF Pregnancy: Especially with donor eggs
    🌍 Ethnic Background: Slight variations in normal ranges
    📅 Gestational Age: Critical for accurate interpretation

    What are Normal Values and Range for Double Marker Test?

    Double marker test results are typically reported as multiples of the median (MoM) rather than absolute concentration values, with a MoM of 1.0 representing the median value for unaffected pregnancies at the same gestational age. For PAPP-A in unaffected pregnancies, the median MoM is 1.0, with values below 0.4 MoM often associated with increased risk for chromosomal abnormalities. For free β-hCG, the median MoM is also 1.0, with values above 2.0-2.5 MoM potentially indicating increased risk for Down syndrome, while values below 0.4 MoM may suggest increased risk for Edwards or Patau syndromes. These values are interpreted in combination rather than in isolation, with specific risk calculation software integrating them with ultrasound and maternal factors.

    The normal ranges for these biomarkers change rapidly during the first trimester, which is why accurate pregnancy dating is crucial for proper interpretation. PAPP-A levels increase significantly throughout pregnancy, approximately doubling every week during the first trimester, while free β-hCG peaks around 10-12 weeks before gradually declining. Different laboratories may have slightly different reference ranges based on their specific population and assay methods, which is why results should always be interpreted using the laboratory’s established medians and algorithms. Extremely abnormal values (very low PAPP-A or extremely high hCG) may warrant additional evaluation even if the overall risk calculation falls below the cutoff for screen positive.

    Normal value guidelines:

    📊 PAPP-A Normal: Approximately 1.0 MoM (range 0.5-2.0)
    📊 Free β-hCG Normal: Approximately 1.0 MoM (range 0.5-2.0)
    ⚠️ Concerning PAPP-A: Below 0.4 MoM
    ⚠️ Concerning hCG: Above 2.5 MoM for Down risk
    📈 Gestational Changes: Markers change rapidly in first trimester
    🔬 Laboratory Variations: Reference ranges differ slightly by lab

    What Happens After a Positive Double Marker Test Result?

    A screen positive double marker test result triggers a recommendation for genetic counseling and discussion of diagnostic testing options to determine whether the fetus actually has a chromosomal abnormality. The primary diagnostic procedures available include chorionic villus sampling (CVS), which can be performed between 10-13 weeks gestation and provides results within 7-10 days, or amniocentesis, typically performed after 15 weeks with results in 10-14 days. Both procedures carry a small risk of pregnancy loss (approximately 0.1-0.3% for amniocentesis and 0.5-1.0% for CVS), which must be weighed against the benefits of definitive diagnostic information. Many providers now recommend NIPT as an intermediate step following a positive double marker test, as it can provide highly accurate screening without procedure-related risks.

    Genetic counseling is an essential component following a positive screen result, helping expectant parents understand the meaning of the results, the limitations of screening tests, the options for diagnostic testing, and the implications of potential diagnoses. Counselors provide balanced, non-directive information to support informed decision-making based on the family’s values and circumstances. For couples who would not consider pregnancy termination regardless of diagnosis, some may still choose diagnostic testing to prepare medically and psychologically for a child with special needs. The counseling process also addresses the emotional impact of receiving a positive screen result and provides resources for support regardless of the decisions made.

    Next steps after positive result:

    🧬 Genetic Counseling: Essential for informed decision-making
    🔍 Diagnostic Testing Options: CVS or amniocentesis
    🩺 NIPT Consideration: Intermediate step before invasive testing
    📋 Risk-Benefit Analysis: Weighing procedure risks against information value
    💭 Decision Support: Non-directive counseling for family choices
    🎯 Preparation: Medical and psychological preparation for possible outcomes

    Can Double Marker Test Detect Gender or Twins Accurately?

    The standard double marker test does not include fetal sex determination, as it measures protein biomarkers that do not provide information about sex chromosomes. However, some laboratories may offer additional testing on the same blood sample to assess fetal sex through different methodologies, though this is not part of the routine chromosomal abnormality screening. In twin pregnancies, the double marker test can be performed but with important limitations – the test provides a combined risk assessment for the pregnancy as a whole rather than individual risk profiles for each fetus, and detection rates are lower compared to singleton pregnancies, particularly for dichorionic twins.

    In twin pregnancies, the interpretation of double marker test results becomes more complex because each fetus contributes to the biomarker levels in maternal blood. The pattern of results may help distinguish between monochorionic (identical) and dichorionic (fraternal) twins in some cases, though ultrasound remains the primary method for determining chorionicity. When one twin has a chromosomal abnormality, the biomarker levels may be less dramatically altered than in a singleton pregnancy with the same condition, potentially reducing the sensitivity of the screening. For these reasons, some experts recommend that women with twin pregnancies consider NIPT instead of traditional serum screening, as NIPT can often provide individual risk assessments for each fetus in a twin pregnancy.

    Detection capabilities:

    🚻 Fetal Sex: Not detected by standard double marker test
    👶👶 Twin Pregnancy: Possible but with reduced accuracy
    📊 Combined Risk: Single risk score for entire twin pregnancy
    🔍 Chorionicity: May provide clues but ultrasound is definitive
    🎯 Detection Rates: Lower in twins compared to singletons
    🧪 NIPT Alternative: Often preferred for twin pregnancies

    How to Prepare for Double Marker Test Procedure?

    Preparation for the double marker test is minimal, requiring no fasting or special dietary restrictions before the blood draw. Patients should maintain normal hydration and medication routines unless specifically instructed otherwise by their healthcare provider. It is helpful to bring complete information to the appointment, including the first day of the last menstrual period, any previous ultrasound reports, relevant medical history, and family history of genetic conditions. For the nuchal translucency ultrasound component, patients should be aware that a full bladder is often recommended to improve ultrasound image quality, though practices vary regarding how full the bladder needs to be.

    Before undergoing the test, patients should have a clear understanding of what the screening can and cannot detect, its limitations, and the potential outcomes including the possibility of receiving a screen positive result. This pre-test counseling, ideally provided by an obstetrician or genetic counselor, helps set appropriate expectations and prepares patients for decision-making that may be needed depending on the results. Patients should also verify insurance coverage for the test if cost is a concern and arrange for the nuchal translucency ultrasound to be performed within the appropriate gestational window relative to the blood draw. Some healthcare systems coordinate these appointments to ensure proper timing between the two components of the screening.

    Preparation checklist:

    💧 Fasting: Not required – eat and drink normally
    💊 Medications: Continue unless specifically instructed otherwise
    📋 Information Needed: LMP date, medical history, family history
    🚰 Ultrasound Preparation: Possibly full bladder requirement
    🧠 Mental Preparation: Understand test limitations and possible outcomes
    📅 Appointment Coordination: Time blood draw and NT ultrasound appropriately

    What are the Risks and Benefits of Double Marker Test?

    The double marker test offers several significant benefits including early detection capability, non-invasive nature with no procedure-related miscarriage risk, and valuable information for pregnancy management decisions. The test provides risk assessment for common chromosomal abnormalities at a gestational age when termination options are more available for those who choose that path, and allows more time for additional testing and decision-making compared to second-trimester screening. For screen-negative results, the test provides reassurance and may reduce anxiety about chromosomal abnormalities, potentially avoiding the need for invasive diagnostic procedures in women who would otherwise be referred based on age alone.

    The primary risks associated with the double marker test are psychological rather than physical, including anxiety while awaiting results and potential distress following a screen-positive result. There is also a risk of false reassurance with screen-negative results, as the test does not detect all cases of chromosomal abnormalities or other birth defects. False-positive results may lead to unnecessary invasive testing with its associated risks, costs, and anxiety. The test cannot detect many other genetic conditions or structural abnormalities beyond the specific trisomies screened, potentially creating a false sense of comprehensive prenatal assessment. These limitations should be thoroughly discussed during pre-test counseling to ensure informed decision-making.

    Benefits and risks analysis:

    ✅ Benefits:

    • Early detection (11-14 weeks)
    • No physical risk to pregnancy
    • High detection rates for major trisomies
    • Reassurance for screen-negative results
    • Time for decision-making and additional testing

    ❌ Risks:

    • Psychological distress from screen-positive results
    • False positives leading to unnecessary invasive testing
    • False negatives providing false reassurance
    • Does not screen for all possible abnormalities
    • Potential for insurance coverage issues

    Double Marker Test and Pregnancy Due Date Calculation Connection

    Accurate pregnancy dating is fundamental to proper interpretation of double marker test results, as the normal ranges for both biochemical markers and nuchal translucency measurements change rapidly during the first trimester. Even a few days’ difference in estimated gestational age can significantly alter the multiples of the median calculations and consequently the final risk assessment. Our pregnancy due date calculator becomes an essential tool in this context, helping women determine their optimal testing window and providing healthcare providers with reliable gestational age estimates for correct result interpretation. The most accurate pregnancy dating combines last menstrual period information with early ultrasound measurements, particularly crown-rump length before 14 weeks.

    The relationship between pregnancy dating and double marker test accuracy highlights why precise due date calculation is crucial before undergoing screening. Women with irregular cycles, recent hormonal contraception use, or uncertain last menstrual period dates should definitely have a dating ultrasound before the test to ensure proper interpretation. The due date calculator helps identify the ideal window for the double marker test (11 weeks 0 days to 13 weeks 6 days) and coordinate the timing between the blood draw and nuchal translucency ultrasound. When discrepancies exist between menstrual dating and ultrasound dating, most laboratories require the ultrasound dating to be used for risk calculation, as it provides more accurate gestational age assessment.

    Dating considerations for accurate screening:

    📅 Gestational Age Critical: Markers change rapidly in first trimester
    🩺 Dating Methods: LMP plus ultrasound most accurate
    🔢 Impact on Results: Small dating errors affect risk calculation significantly
    🎯 Optimal Timing: 11-14 weeks for double marker test
    📊 Ultrasound Preference: Used over LMP when discrepancy exists
    ⏰ Coordination: Blood draw and NT timing relative to due date

    Latest Advances in First Trimester Screening Technologies

    First-trimester prenatal screening continues to evolve with several significant advances improving accuracy, expanding detection capabilities, and enhancing patient experience. Cell-free DNA testing (NIPT) represents the most substantial advancement, offering higher detection rates and lower false-positive rates for common trisomies, with expanding capabilities to detect microdeletion syndromes and rare autosomal trisomies. The development of automated NT measurement software improves the consistency and quality of ultrasound assessment, while new algorithms incorporating additional ultrasound markers like nasal bone assessment and ductus venosus flow further refine risk assessment beyond the basic combined screening.

    Research continues into new first-trimester biomarkers that could improve detection rates for a wider range of conditions. Proteomic and metabolomic approaches analyzing multiple proteins and metabolites in maternal blood show promise for detecting conditions like preeclampsia and fetal growth restriction earlier in pregnancy. Machine learning applications are being developed to create more sophisticated risk prediction models that incorporate a wider array of maternal characteristics, biomarker patterns, and ultrasound findings. Meanwhile, efforts to reduce the cost of NIPT may eventually make it the primary screening tool for all pregnancies, though the additional structural information provided by the NT ultrasound will likely maintain its importance in comprehensive first-trimester assessment.

    Recent technological advances:

    🧬 NIPT Expansion: Detection of microdeletions and rare trisomies
    🤖 Automated NT: Improved consistency of ultrasound measurements
    🔍 Additional Markers: Nasal bone, ductus venosus flow
    🧪 Proteomics: Multiple protein analysis for broader condition detection
    🧠 AI Algorithms: Enhanced risk prediction models
    💰 Cost Reduction: Making advanced screening more accessible

    Frequently Asked Questions About Double Marker Test

    What is the difference between double marker test and triple marker test?
    The double marker test measures two biomarkers (PAPP-A and free β-hCG) in the first trimester, while the triple marker test measures three biomarkers (AFP, hCG, and uE3) in the second trimester. The double marker test has higher detection rates for Down syndrome (85-90% vs 70-75%) and is performed earlier in pregnancy, allowing more time for decision-making. The triple marker test provides screening for open neural tube defects in addition to chromosomal abnormalities, which the double marker test does not assess.

    Can double marker test be done after 14 weeks?
    The double marker test is specifically designed for the first trimester between 11 weeks 0 days and 13 weeks 6 days. After 14 weeks, the biomarker patterns change and the test loses its accuracy for chromosomal abnormality screening. The nuchal translucency measurement can also only be obtained during this specific window. Women who miss the first-trimester window can consider second-trimester screening options including the quadruple marker test or NIPT.

    Is double marker test compulsory during pregnancy?
    No, the double marker test is an optional screening test, not a compulsory component of prenatal care. The decision to undergo prenatal genetic screening is personal and should be based on individual values, risk factors, and after thorough counseling about the benefits and limitations. Some women choose to decline all screening, while others may opt for different screening approaches such as NIPT or second-trimester screening.

    Does double marker test require ultrasound?
    While the blood component of the double marker test can be performed alone, its accuracy is significantly enhanced when combined with the nuchal translucency ultrasound measurement. The combination of both tests (first-trimester combined screening) increases the detection rate for Down syndrome from approximately 70% with blood tests alone to 85-90% with the combined approach. Most healthcare providers strongly recommend completing both components for optimal screening performance.

    What if I miss the double marker test timing?
    If you miss the window for the double marker test (11-14 weeks), several alternative screening options remain available. These include NIPT (which can be performed from 10 weeks onward), second-trimester serum screening (quadruple marker test at 15-20 weeks), or a combination approach called integrated screening that uses first and second-trimester markers. Diagnostic testing through amniocentesis is also an option after 15 weeks for women who desire definitive information.

    Can double marker test be wrong?
    Yes, the double marker test can produce both false-positive and false-negative results. Approximately 5% of normal pregnancies receive screen-positive results (false positives), while about 10-15% of Down syndrome pregnancies may be missed (false negatives). The test is a screening tool assessing probability, not a diagnostic test providing definitive answers. This is why screen-positive results require confirmation through diagnostic testing before making irreversible pregnancy decisions.

    How long does it take to get double marker test results?
    Double marker test results typically take 7-14 days to process, though this can vary by laboratory and healthcare system. Some facilities may provide results more quickly, while integrated screening approaches that combine first and second-trimester tests delay final results until the second trimester. The timing of results should be discussed during pre-test counseling so patients know what to expect and can prepare for possible decision-making based on the outcomes.

    Disclaimer: This article provides educational information about prenatal screening and should not replace professional medical advice. Always consult with qualified healthcare providers for personal medical decisions regarding pregnancy care and testing options.

    PETH-Test-Alcohol-Consumption-Monitoring

    PETH Test: Alcohol Consumption Monitoring

    Phosphatidylethanol (PETH) testing represents a groundbreaking advancement in alcohol consumption monitoring, offering unprecedented accuracy in detecting alcohol use over extended periods. This comprehensive guide explores how PETH testing works, its clinical applications, and why it’s becoming the gold standard for alcohol monitoring in legal, medical, and workplace settings.

    In this complete PETH test guide, you’ll discover:

    • How PETH testing detects alcohol consumption with 99% accuracy
    • The science behind phosphatidylethanol biomarkers
    • Clinical applications in liver health assessment
    • Comparison with traditional alcohol testing methods
    • Legal and workplace implementation guidelines
    • Future developments in alcohol monitoring technology

    Lever Health Calculator

    Lever Health Calculator

    Assess your liver health with our comprehensive calculator

    1
    Demographics
    2
    Medical History
    3
    Lifestyle
    4
    Results

    Demographic Information

    Please provide your basic information

    Medical History

    Please provide information about your medical history

    Hold Ctrl/Cmd to select multiple options
    Hold Ctrl/Cmd to select multiple options
    Hold Ctrl/Cmd to select multiple options
    / mmHg

    Lifestyle Factors

    Please provide information about your lifestyle

    7 hours
    5 (Moderate)

    Your Lever Health Assessment

    Based on the information you provided

    0
    Low Risk Moderate Risk High Risk
    Low Risk

    Interpretation

    Your liver health appears to be in good condition based on the information provided. Continue maintaining a healthy lifestyle.

    Personalized Recommendations

    • Maintain a balanced diet rich in fruits and vegetables
    • Engage in regular physical activity
    • Limit alcohol consumption
    • Stay hydrated by drinking plenty of water

    Disclaimer: This calculator provides an estimate based on the information you provided and is not a substitute for professional medical advice. Please consult with a healthcare provider for personalized medical guidance.

    Try More Free Tools:

    Free-PETH-Test-Alcohol-Consumption-Monitoring

    What is a PETH Test and How Does It Work?

    A PETH test, or phosphatidylethanol test, is a specialized blood test that detects alcohol consumption by measuring PEth biomarkers in red blood cell membranes. Unlike traditional alcohol tests that measure immediate alcohol presence, PETH testing identifies specific phospholipids formed only when alcohol is present in the body, providing a much longer detection window and higher accuracy.

    PEth forms through a process called transphosphatidylation, where phospholipase D uses ethanol instead of water as a substrate. This reaction creates unique biomarkers that accumulate in red blood cells and remain detectable for up to 4 weeks after alcohol consumption. The test primarily measures PEth 16:0/18:1, the most abundant and well-studied variant, though advanced testing can identify multiple PEth homologues for even greater accuracy.

    The PETH testing process involves:

    • Blood collection via venipuncture
    • Laboratory analysis using liquid chromatography-tandem mass spectrometry
    • Quantification of PEth levels in whole blood samples
    • Interpretation based on established cutoff values
    • Reporting results with clinical context

    Clinical laboratories typically report PETH results in nanograms per milliliter (ng/mL), with cutoff values established to distinguish between various levels of alcohol consumption. The standard cutoff for detecting any alcohol consumption is typically 20 ng/mL, while higher levels indicate heavier or more recent drinking patterns.

    How Does PETH Testing Compare to Traditional Alcohol Monitoring Methods?

    PETH testing offers significant advantages over traditional alcohol monitoring methods, particularly in detection window accuracy and resistance to manipulation. While traditional methods have their place in alcohol monitoring, PETH testing provides unique benefits that make it increasingly preferred in clinical and legal contexts.

    Traditional alcohol testing methods include:

    • Breath alcohol testing: Measures current blood alcohol concentration
    • Urine ethyl glucuronide (EtG) testing: Detects alcohol metabolites in urine
    • Blood alcohol content (BAC) testing: Measures current alcohol levels
    • Hair alcohol testing: Detects alcohol markers over several months
    • Liver function tests: Indirect indicators of alcohol consumption

    Comparison of detection windows:

    • PETH test: 2-4 weeks
    • Urine EtG: 1-5 days
    • Blood alcohol: 6-12 hours
    • Breath alcohol: 12-24 hours
    • Hair testing: Up to 90 days

    PETH testing demonstrates superior specificity compared to urine EtG testing, which can produce false positives from environmental alcohol exposure. The direct measurement of alcohol biomarkers in blood provides more reliable results than indirect liver function tests, which can be affected by non-alcohol-related health conditions.

    What Are the Clinical Applications of PETH Testing in Healthcare?

    PETH testing has revolutionized alcohol monitoring in clinical settings, providing healthcare providers with reliable data for diagnosis, treatment planning, and monitoring compliance. The test’s extended detection window and high accuracy make it invaluable across multiple medical specialties.

    In hepatology and gastroenterology, PETH testing helps:

    • Assess alcohol consumption in patients with liver disease
    • Monitor abstinence in alcohol-related hepatitis patients
    • Evaluate candidacy for liver transplantation
    • Monitor post-transplant alcohol abstinence
    • Differentiate between alcoholic and non-alcoholic liver disease

    In addiction medicine, PETH testing supports:

    • Objective monitoring of treatment compliance
    • Relapse detection in recovery programs
    • Medication management for alcohol use disorder
    • Assessment of controlled drinking patterns
    • Evaluation of treatment effectiveness

    Psychiatric applications include:

    • Monitoring alcohol use in patients with dual diagnosis
    • Ensuring medication compliance in substance use disorders
    • Assessing alcohol consumption in psychiatric medication management
    • Supporting court-ordered treatment monitoring
    • Evaluating patients in workplace assistance programs

    Primary care physicians utilize PETH testing for:

    • Routine health assessments with alcohol screening
    • Monitoring patients with alcohol-related health conditions
    • Assessing medication adherence where alcohol is contraindicated
    • Evaluating patients before prescribing controlled substances
    • General wellness and preventive care consultations

    How Accurate is PETH Testing for Detecting Alcohol Consumption?

    PETH testing demonstrates exceptional accuracy in detecting alcohol consumption, with clinical studies showing sensitivity and specificity rates exceeding 95% for detecting moderate to heavy drinking patterns. The test’s scientific foundation in direct biomarker detection eliminates many limitations of traditional alcohol testing methods.

    Key accuracy metrics for PETH testing include:

    • Sensitivity: 96-99% for detecting heavy drinking
    • Specificity: 94-98% for distinguishing abstainers from drinkers
    • Detection threshold: As low as 1-2 standard drinks per day
    • Quantitative correlation: PEth levels correlate with alcohol consumption amount
    • Timeframe accuracy: Precisely reflects 2-4 week drinking history

    Factors affecting PETH test accuracy:

    • Individual metabolic variations
    • Hematological conditions affecting red blood cell lifespan
    • Extreme alcohol consumption patterns
    • Laboratory methodology and cutoff values
    • Sample handling and storage conditions

    Clinical validation studies have demonstrated PETH testing’s superiority over self-reported drinking diaries and traditional biomarkers. Research shows patients consistently underreport alcohol consumption by 40-60%, while PETH testing provides objective, quantifiable data unaffected by patient reporting bias.

    What Do PETH Test Results Mean and How Are They Interpreted?

    Interpreting PETH test results requires understanding the relationship between PEth levels and alcohol consumption patterns. Results are typically reported quantitatively, allowing clinicians to assess both the presence and extent of alcohol consumption during the detection window.

    Standard PETH result interpretation guidelines:

    • < 20 ng/mL: Consistent with abstinence or minimal alcohol intake
    • 20-200 ng/mL: Suggests light to moderate social drinking
    • 200-400 ng/mL: Indicates moderate to heavy alcohol consumption
    • 400 ng/mL: Consistent with heavy, frequent alcohol use
    • 1000 ng/mL: Suggests very heavy, potentially harmful drinking

    Clinical context considerations for interpretation:

    • Individual patient characteristics and medical history
    • Concomitant medication use
    • Liver function status
    • Time since last reported drink
    • Previous testing history and trends
    • Purpose of testing (clinical vs. legal)

    Special interpretation circumstances:

    • Patients with hematological disorders may show altered PEth kinetics
    • Recent blood transfusions can affect result accuracy
    • Extreme obesity may influence PEth formation and elimination
    • Genetic variations in alcohol metabolism enzymes
    • Concomitant use of certain medications

    PETH testing serves diverse populations across medical, legal, and workplace settings. Understanding the appropriate indications for testing ensures optimal utilization of this powerful monitoring tool while maintaining ethical testing practices.

    Medical indications for PETH testing include:

    • Liver disease patients requiring abstinence monitoring
    • Pre-transplant evaluation for organ candidacy
    • Medication management requiring alcohol avoidance
    • Addiction treatment compliance verification
    • Unexplained liver enzyme elevations
    • Assessment of alcohol-related health risks

    Legal and forensic applications:

    • Child custody and family court cases
    • DUI/DWI monitoring programs
    • Probation and parole compliance
    • Professional license monitoring
    • Military and government security clearances
    • Legal proceedings requiring alcohol history

    Workplace testing scenarios:

    • Safety-sensitive position monitoring
    • Return-to-work evaluations
    • Employee assistance program compliance
    • Professional certification requirements
    • Workplace accident investigations
    • Pre-employment screening for specific roles

    Specific patient populations benefiting from PETH testing:

    • Healthcare professionals in monitoring programs
    • Commercial drivers subject to alcohol restrictions
    • Aviation personnel with medical certification requirements
    • Patients with alcohol-sensitive medical conditions
    • Individuals in recovery maintenance programs
    • Patients undergoing certain medical treatments

    How is PETH Testing Performed and What is the Testing Process?

    The PETH testing process involves specific procedures from sample collection to result reporting, ensuring accurate and reliable outcomes. Understanding the testing methodology helps healthcare providers and patients navigate the process effectively.

    Sample collection requirements:

    • Blood draw via venipuncture
    • EDTA or heparin blood collection tubes
    • Standard phlebotomy procedures
    • Proper sample labeling and chain of custody
    • Timely transportation to testing laboratory
    • Appropriate storage conditions

    Laboratory analysis methodology:

    • Liquid chromatography separation
    • Tandem mass spectrometry detection
    • Quantitative measurement of PEth homologues
    • Quality control procedures
    • Method validation and verification
    • Result interpretation and reporting

    Turnaround time and reporting:

    • Standard processing: 3-5 business days
    • Expedited processing: 24-48 hours available
    • Electronic result reporting
    • Clinical consultation services
    • Interpretation guidelines
    • Follow-up testing recommendations

    Pre-test considerations:

    • Patient education and consent
    • Clinical indication documentation
    • Insurance pre-authorization when required
    • Appropriate test ordering
    • Collection facility coordination
    • Result management planning

    What Are the Limitations and Considerations of PETH Testing?

    While PETH testing offers significant advantages, understanding its limitations ensures appropriate application and interpretation. Several factors can influence test results and their clinical significance.

    Technical limitations include:

    • Inability to detect single drinking episodes
    • Limited utility for acute intoxication assessment
    • Blood sample requirements
    • Specialized laboratory needed
    • Higher cost than some alternative methods
    • Turnaround time considerations

    Biological factors affecting results:

    • Individual variation in PEth formation
    • Red blood cell lifespan variations
    • Hematological conditions
    • Extreme alcohol consumption patterns
    • Genetic metabolic differences
    • Concomitant health conditions

    Practical considerations:

    • Insurance coverage variations
    • Availability of testing facilities
    • Regulatory requirements in some jurisdictions
    • Ethical considerations in mandatory testing
    • Patient acceptance and compliance
    • Follow-up testing requirements

    Clinical interpretation challenges:

    • Establishing individual baseline levels
    • Distinguishing between drinking patterns
    • Correlation with clinical outcomes
    • Integration with other assessment methods
    • Long-term monitoring strategies
    • Result communication to patients

    How Much Does PETH Testing Cost and Is It Covered by Insurance?

    PETH testing costs vary based on several factors, including testing purpose, laboratory, geographic location, and additional services required. Understanding the financial aspects helps patients and providers make informed testing decisions.

    Cost ranges for PETH testing:

    • Basic PETH test: $150-$300
    • Comprehensive alcohol biomarker panel: $300-$500
    • Legal testing with chain of custody: $200-$400
    • Expedited processing: Additional $50-$150
    • Physician interpretation services: $50-$150

    Insurance coverage considerations:

    • Medical necessity requirements
    • Pre-authorization requirements
    • In-network laboratory restrictions
    • Deductible and copayment applications
    • Coverage limitations for screening purposes
    • Documentation requirements

    Self-pay options include:

    • Direct patient billing
    • Cash pricing discounts
    • Payment plans
    • Employer direct billing
    • Legal case billing
    • Institutional contracts

    Cost-effectiveness analysis:

    • Reduced healthcare utilization with accurate monitoring
    • Improved treatment outcomes
    • Legal cost savings in custody cases
    • Workplace productivity benefits
    • Prevention of alcohol-related complications
    • Long-term healthcare cost reduction

    PETH testing raises important legal and ethical considerations, particularly in non-voluntary testing scenarios. Understanding these aspects ensures appropriate, legally compliant testing practices across all applications.

    Legal considerations include:

    • Informed consent requirements
    • Chain of custody procedures
    • Result admissibility in legal proceedings
    • Privacy and confidentiality protections
    • Regulatory compliance requirements
    • Reporting obligations

    Ethical principles in PETH testing:

    • Respect for patient autonomy
    • Beneficence in clinical application
    • Non-maleficence in result interpretation
    • Justice in testing access and application
    • Truthfulness in result reporting
    • Confidentiality maintenance

    Special population considerations:

    • Minors and consent requirements
    • Pregnant patients
    • Cognitively impaired individuals
    • Prisoners and detained persons
    • Employees in workplace testing
    • Military personnel

    Best practices for ethical testing:

    • Clear testing purpose communication
    • Appropriate consent procedures
    • Confidential result management
    • Clinical result interpretation
    • Follow-up planning
    • Documentation standards

    How Does PETH Testing Integrate with Comprehensive Alcohol Assessment?

    PETH testing functions most effectively as part of a comprehensive alcohol assessment strategy, combining objective biomarker data with clinical evaluation, patient history, and additional assessment tools for complete patient evaluation.

    Components of comprehensive alcohol assessment:

    • PETH testing for objective consumption data
    • Clinical interview and history
    • Physical examination findings
    • Laboratory testing including liver function
    • Psychological assessment tools
    • Social and functional assessment

    Integration with other alcohol biomarkers:

    • Liver enzyme patterns (GGT, AST, ALT)
    • Carbohydrate-deficient transferrin (CDT)
    • Mean corpuscular volume (MCV)
    • Urine ethyl glucuronide (EtG)
    • Blood alcohol concentration
    • Hair alcohol testing

    Assessment timing strategies:

    • Baseline assessment establishment
    • Regular monitoring intervals
    • Trigger-based testing
    • Treatment milestone evaluation
    • Long-term follow-up planning
    • Integration with clinical care

    Multidisciplinary approach benefits:

    • Medical management integration
    • Psychological support coordination
    • Social service involvement
    • Legal system coordination
    • Workplace accommodation planning
    • Family education and support

    What Are the Future Developments in PETH Testing Technology?

    PETH testing continues to evolve with technological advancements, research developments, and expanding clinical applications. Understanding emerging trends helps healthcare providers anticipate future testing improvements and applications.

    Technological advancements include:

    • Point-of-care testing development
    • Enhanced sensitivity methodologies
    • Multiple PEth homologue measurement
    • Automated interpretation algorithms
    • Integrated testing platforms
    • Mobile result reporting systems

    Research directions:

    • Genetic influences on PEth formation
    • PEth kinetics in special populations
    • Correlation with health outcomes
    • New clinical applications
    • Cost-effectiveness studies
    • International standardization

    Regulatory developments:

    • Standardized cutoff values
    • Quality assurance programs
    • Laboratory certification requirements
    • Reimbursement policy updates
    • International harmonization
    • Legal precedent establishment

    Clinical practice integration:

    • Electronic health record integration
    • Clinical decision support tools
    • Telemedicine applications
    • Population health screening
    • Preventive medicine applications
    • Personalized medicine approaches

    Frequently Asked Questions About PETH Testing

    How long does alcohol stay detectable in a PETH test?
    PETH testing typically detects alcohol consumption for 2-4 weeks after drinking, depending on the amount and frequency of alcohol consumption. Heavy drinkers may show detectable levels for up to 4 weeks, while light social drinkers typically clear PEth biomarkers within 2-3 weeks. The detection window represents cumulative exposure rather than single episodes.

    Can PETH testing distinguish between different types of alcohol?
    No, PETH testing cannot distinguish between different types of alcoholic beverages. The test measures PEth biomarkers formed from ethanol metabolism, regardless of whether the alcohol source is beer, wine, spirits, or other alcoholic beverages. The test quantifies total alcohol consumption rather than identifying specific drink types.

    Is PETH testing affected by hand sanitizers or other alcohol-containing products?
    PETH testing is generally not affected by external alcohol exposure from hand sanitizers, cleaning products, or environmental sources. The test specifically measures biomarkers formed through internal metabolic processes rather than detecting alcohol directly. However, excessive inhalation or absorption in unusual circumstances could theoretically affect results, though this is rare.

    What is the difference between PETH testing and traditional liver function tests?
    PETH testing directly measures alcohol-specific biomarkers, while liver function tests measure indirect indicators of liver damage or stress. PETH testing specifically identifies alcohol consumption, while liver enzymes can be elevated due to various non-alcohol-related conditions including medications, infections, and other liver diseases.

    Can medications or health conditions affect PETH test results?
    Most medications do not significantly affect PETH test results, though extreme health conditions affecting red blood cell production or lifespan could potentially influence PEth levels. Hematological disorders, recent blood transfusions, and severe liver disease may require special interpretation consideration. Always inform your healthcare provider about all medications and health conditions.

    How accurate is PETH testing compared to other alcohol monitoring methods?
    PETH testing demonstrates superior accuracy compared to most traditional alcohol monitoring methods, with sensitivity and specificity rates typically exceeding 95%. It provides more reliable detection than urine tests, longer detection than blood alcohol tests, and more specific results than indirect liver function markers.

    Is PETH testing approved for legal and workplace applications?
    Yes, PETH testing is widely accepted in legal and workplace settings when properly conducted with chain of custody procedures. Courts, employers, and regulatory agencies increasingly recognize PETH testing as a reliable method for alcohol monitoring due to its extended detection window and high accuracy.

    Professional-Grade Home Alcohol Monitoring Systems

    • Soberlink Advanced Alcohol Monitoring System: Real-time breath testing with facial recognition
    • BACtrack Professional Grade Breathalyzers: Law enforcement-grade accuracy for personal use
    • AlcoCheck Digital Alcohol Detector: Professional portable breathalyzer with smartphone integration

    Liver Health Supplements and Support Products

    • Pure Encapsulations Liver-G.I. Detox: Comprehensive liver support supplement
    • Thorne Research Liver Cleanse: Physician-formulated liver detoxification support
    • Jarrow Formulas Milk Thistle: Silymarin extract for liver health maintenance
    • Gaia Herbs Liver Cleanse: Organic herbal liver support formula

    Alcohol Recovery and Support Resources

    • The Sinclair Method Resources: Medication-assisted treatment materials
    • SMART Recovery Handbooks: Cognitive-behavioral approach to addiction recovery
    • Sober Grid Membership: Social support network for recovery maintenance
    • Tempest Recovery Program: Digital recovery support platform

    Professional Testing Services

    • Quest Diagnostics PETH Testing: Nationwide laboratory testing services
    • LabCorp Alcohol Biomarker Testing: Comprehensive alcohol monitoring panels
    • Legacy Laboratory Services: Specialized addiction medicine testing
    • US Drug Test Centers PETH Testing: Nationwide testing facility network

    Disclaimer: This calculator provides educational estimates only and is not a substitute for professional medical advice. Always consult healthcare providers for alcohol-related health concerns.

    CEA-Test-Carcinoembryonic-Antigen-Cancer-Monitoring

    CEA Test: Carcinoembryonic Antigen Cancer Monitoring

    The Carcinoembryonic Antigen (CEA) test is a crucial blood test used primarily for monitoring cancer treatment effectiveness and detecting recurrence in certain cancer types. This comprehensive guide explores everything from basic CEA test fundamentals to advanced clinical applications, providing patients and healthcare providers with essential knowledge about this important tumor marker and its role in modern cancer management.

    What You’ll Learn From This Comprehensive Guide

    • Understanding CEA test fundamentals and clinical significance
    • Interpreting CEA test results and normal ranges
    • CEA testing in different cancer types and stages
    • Factors affecting CEA levels beyond cancer
    • Latest advancements in CEA monitoring technology
    • How to use our free CEA risk assessment calculator
    • When CEA testing is recommended and its limitations
    • Future directions in cancer biomarker testing

    CEA Cancer Symptoms Checker | Doseway

    Carcinoembryonic Antigen (CEA) Cancer Symptoms Checker

    Assess your risk factors and symptoms related to CEA levels

    Disclaimer: This tool is for informational purposes only and is not a substitute for professional medical advice, diagnosis, or treatment. Always seek the advice of your physician with any questions you may have regarding a medical condition.
    1
    2
    3
    4
    5
    Demographics
    Medical History
    Symptoms
    Lifestyle
    Results

    Demographic Information

    Medical History

    Symptoms & CEA Information

    Normal range is typically 0-3 ng/mL for non-smokers and 0-5 ng/mL for smokers

    Lifestyle Factors

    5
    7 hours

    Your CEA Assessment Results

    0

    Risk Score (0-100)

    Low Risk Moderate Risk High Risk

    Try More Free Tools:

    Free-CEA-Test-Carcinoembryonic-Antigen-Cancer-Monitoring

    What is Carcinoembryonic Antigen (CEA) and Why is it Important?

    Carcinoembryonic Antigen (CEA) is a protein that normally appears in the tissue of a developing baby during pregnancy. The production of CEA stops before birth, and healthy adults should have very low levels. However, certain cancers can cause CEA levels to rise, making it a valuable tumor marker for monitoring cancer treatment and recurrence.

    CEA testing measures the amount of this protein in the blood. While not used for initial cancer diagnosis, CEA tests are particularly valuable for monitoring treatment response in colorectal cancer, as well as other cancers including pancreatic, gastric, lung, and breast cancers. The test helps oncologists determine if cancer is responding to treatment, detect recurrence early, and assess prognosis.

    The clinical importance of CEA monitoring extends beyond simple number tracking. Serial CEA measurements provide dynamic information about disease behavior, helping clinicians make informed decisions about continuing, modifying, or changing treatment approaches. When used appropriately, CEA testing can significantly impact patient outcomes through early detection of recurrence and timely intervention.

    How Does the CEA Test Work? Understanding the Science Behind Tumor Markers

    The CEA test is a simple blood draw that measures the concentration of carcinoembryonic antigen in the bloodstream. This glycoprotein is part of the immunoglobulin superfamily and normally functions in cell adhesion. In cancer cells, regulation of CEA production is lost, leading to elevated levels that can be detected through immunoassay techniques.

    Modern CEA testing typically uses one of two methods: enzyme-linked immunosorbent assay (ELISA) or chemiluminescent immunoassay. Both methods rely on antibodies that specifically bind to CEA molecules. The test sensitivity has improved significantly over time, with current assays capable of detecting CEA concentrations as low as 0.2 ng/mL.

    The testing process involves several key steps:

    • Blood sample collection via venipuncture
    • Sample processing to separate serum or plasma
    • Incubation with CEA-specific antibodies
    • Detection of antibody-CEA complexes
    • Quantification of CEA concentration

    It’s important to note that CEA levels must be interpreted in the context of the individual patient. Baseline measurements are often established before cancer treatment begins, with subsequent tests compared to this baseline to monitor changes over time.

    What Are Normal CEA Levels and How Are They Interpreted?

    Understanding CEA test results requires knowledge of normal ranges and the factors that can influence these levels. For non-smoking adults, the normal range for CEA is typically between 0 and 3.0 nanograms per milliliter (ng/mL). For smokers, slightly higher levels up to 5.0 ng/mL may be considered normal due to the effect of smoking on CEA production.

    CEA Level Interpretation Guidelines:

    • Normal range: 0-3.0 ng/mL for non-smokers, 0-5.0 ng/mL for smokers
    • Mild elevation: 5-10 ng/mL may indicate benign conditions or early cancer
    • Moderate elevation: 10-20 ng/mL often associated with cancer presence
    • Significant elevation: >20 ng/mL strongly suggests cancer, often with metastatic disease

    The rate of change in CEA levels is often more important than a single measurement. A rapidly rising CEA level, even within the “normal” range, may indicate disease progression. Conversely, a declining CEA level typically indicates positive response to treatment.

    Clinical interpretation always considers the complete picture, including:

    • Patient’s cancer type and stage
    • Treatment history and timing
    • Baseline CEA levels
    • Trend over multiple measurements
    • Correlation with imaging and other tests

    CEA testing serves specific purposes in the cancer journey and isn’t appropriate for general cancer screening in healthy individuals. The primary applications include monitoring known cancer cases, with specific timing and frequency determined by the cancer type, stage, and treatment plan.

    For colorectal cancer, CEA testing is recommended:

    • Before surgery to establish a baseline
    • Every 3-6 months for 2 years after curative treatment
    • Every 6 months for years 3-5
    • When symptoms suggest possible recurrence

    In other gastrointestinal cancers, CEA monitoring may be used alongside other tumor markers. For breast cancer, CEA testing is sometimes used when cancer has spread beyond the breast, particularly to bones or liver. Lung cancer monitoring may include CEA in certain cases, especially adenocarcinoma types.

    The National Comprehensive Cancer Network (NCCN) guidelines specify appropriate use of CEA testing. Following these evidence-based recommendations ensures optimal use of this biomarker while avoiding unnecessary testing that could lead to false alarms or unnecessary procedures.

    What Cancers are Associated with Elevated CEA Levels?

    While CEA is most strongly associated with colorectal cancer, several other malignancies can cause elevated levels. Understanding which cancers produce CEA helps interpret test results appropriately and guides further diagnostic evaluation when needed.

    Cancers commonly associated with elevated CEA:

    • Colorectal cancer: Strongest association, used for monitoring
    • Pancreatic cancer: Often produces high CEA levels
    • Gastric cancer: Moderate association with CEA elevation
    • Lung cancer: Particularly adenocarcinoma and large cell carcinoma
    • Breast cancer: Especially with metastatic disease
    • Medullary thyroid cancer: Specific utility in this type
    • Ovarian cancer: Mucinous types more than serous

    The degree of CEA elevation often correlates with tumor burden and disease stage. Metastatic disease typically produces higher CEA levels than localized cancer. Some cancer types, such as prostate cancer and renal cell carcinoma, rarely elevate CEA, making it less useful for monitoring these malignancies.

    Patterns of CEA elevation can sometimes provide clues about the cancer type or location. For example, very high CEA levels (>100 ng/mL) often suggest gastrointestinal cancers, particularly colorectal or pancreatic origin. However, tissue diagnosis through biopsy remains essential for definitive cancer typing.

    What Non-Cancerous Conditions Can Cause Elevated CEA Levels?

    Several benign conditions can increase CEA levels, making interpretation challenging. Recognizing these non-cancerous causes helps prevent unnecessary alarm and guides appropriate follow-up when CEA elevation occurs.

    Common benign causes of CEA elevation:

    • Smoking: The most common cause of mildly elevated CEA
    • Inflammatory bowel disease: Crohn’s disease and ulcerative colitis
    • Pancreatitis: Acute or chronic inflammation
    • Liver disease: Hepatitis, cirrhosis, or alcoholic liver disease
    • Gastric ulcers: Particularly when inflamed or bleeding
    • Pneumonia: Lung inflammation of various causes
    • Diverticulitis: Colon inflammation
    • Diabetes: Particularly with poor control
    • Autoimmune conditions: Rheumatoid arthritis, lupus

    The degree of elevation in benign conditions is typically mild to moderate, usually below 10 ng/mL. However, severe inflammation or extensive tissue damage can occasionally produce higher levels. The pattern of CEA elevation in benign conditions often differs from cancer-related increases, with benign causes typically showing stability or fluctuation rather than steady progression.

    When CEA elevation occurs without known cancer, the approach involves:

    • Repeating the test to confirm persistence
    • Evaluating for potential benign causes
    • Considering imaging if levels are significantly elevated
    • Monitoring trend over time rather than single values

    How is CEA Testing Used in Colorectal Cancer Management?

    Colorectal cancer represents the most established application for CEA testing, with well-defined protocols for its use throughout the cancer journey. From diagnosis to survivorship, CEA monitoring provides valuable information that guides treatment decisions.

    In preoperative evaluation, CEA testing helps establish a baseline. Patients with elevated preoperative CEA that doesn’t normalize after surgery may have residual disease. Extremely high preoperative CEA levels may suggest more advanced disease than initially apparent on imaging.

    During active treatment, CEA trends help assess chemotherapy effectiveness. A declining CEA level typically indicates response to treatment, while rising levels suggest progression. However, some chemotherapy regimens can cause transient CEA elevation due to tumor cell death and release of markers.

    In post-treatment surveillance, CEA testing aims to detect recurrence early when it may be more treatable. The American Society of Clinical Oncology (ASCO) guidelines recommend CEA testing every 3-6 months for stage II and III colorectal cancer for at least 3 years after diagnosis. Rising CEA should prompt further investigation with imaging.

    The limitations of CEA in colorectal cancer include:

    • Not all colorectal cancers produce CEA
    • Normal CEA doesn’t guarantee absence of recurrence
    • Benign conditions can cause false positives
    • Timing of testing relative to treatment affects interpretation

    What Are the Limitations and Accuracy of CEA Testing?

    Understanding the limitations of CEA testing is crucial for proper interpretation and avoiding clinical missteps. No test is perfect, and CEA measurement has specific constraints that affect its utility in different situations.

    Sensitivity and specificity vary by cancer type and stage:

    • Sensitivity for detecting recurrent colorectal cancer: 58-84%
    • Specificity for cancer versus benign conditions: approximately 70%
    • Predictive value depends on pre-test probability

    The moderate accuracy of CEA testing means it should never be used in isolation. Clinical decisions require correlation with:

    • Physical examination findings
    • Imaging studies (CT, MRI, PET)
    • Other laboratory tests
    • Patient symptoms and functional status

    Factors affecting CEA test reliability include:

    • Assay variability between laboratories
    • Timing relative to treatment cycles
    • Concurrent medications affecting CEA production
    • Presence of heterophilic antibodies causing false results
    • Sample handling and processing variations

    Despite these limitations, CEA testing remains valuable when used appropriately within its established clinical applications. The trend over multiple measurements provides more reliable information than single values, and integration with other clinical data enhances its utility.

    How Often Should CEA Testing Be Performed During Cancer Monitoring?

    The frequency of CEA testing depends on the cancer type, stage, treatment phase, and individual patient factors. Evidence-based guidelines provide general recommendations, but testing schedules should be individualized based on clinical circumstances.

    For colorectal cancer surveillance after curative treatment:

    • Every 3-6 months for years 1-2
    • Every 6 months for years 3-5
    • Annually beyond 5 years for high-risk cases

    During active treatment for metastatic disease:

    • Every 1-3 treatment cycles
    • More frequently when treatment changes are considered
    • Correlated with imaging assessment schedules

    In other cancers where CEA is monitored:

    • Frequency determined by cancer behavior and treatment plan
    • Typically every 1-3 months during active monitoring
    • Less frequently during long-term stability

    Factors justifying more frequent testing include:

    • Rapidly rising trend on previous tests
    • High-risk cancer features
    • Recent treatment change
    • Concerning symptoms developing
    • Equivocal imaging findings

    Less frequent testing may be appropriate when:

    • Consistently stable low levels over extended time
    • Advanced cancer with limited treatment options
    • Patient preference to minimize testing
    • Significant comorbidities limiting intervention options

    What Do Rising CEA Levels Indicate During Cancer Surveillance?

    A rising CEA trend during cancer monitoring requires careful interpretation, as it can signal various clinical scenarios. Understanding the patterns and context of CEA elevation helps determine the appropriate response.

    Possible meanings of rising CEA levels:

    • Cancer progression: Increasing tumor burden or new metastases
    • Treatment resistance: Cancer no longer responding to current therapy
    • Cancer recurrence: Return of cancer after previous remission
    • Pseudo-progression: Temporary increase due to treatment effect
    • Benign condition: New or worsening non-cancerous cause

    The rate of CEA rise provides important clues. A slow, gradual increase may suggest indolent progression, while a rapid doubling within weeks often indicates aggressive disease. The magnitude of elevation also matters, with higher levels typically correlating with greater tumor burden.

    The clinical approach to rising CEA includes:

    • Confirming the trend with repeat testing
    • Reviewing for new symptoms or physical findings
    • Obtaining appropriate imaging studies
    • Evaluating for potential benign causes
    • Considering treatment modification if cancer progression confirmed

    In some cases, CEA elevation precedes radiological evidence of recurrence by several months. This lead time can potentially allow earlier intervention, though the benefits of preemptive treatment based solely on CEA rise remain uncertain and require individualized decision-making.

    How Does CEA Testing Compare to Other Tumor Markers?

    CEA is one of many tumor markers used in cancer care, each with specific strengths, limitations, and clinical applications. Understanding how CEA compares to other markers helps clinicians select the most appropriate tests for each situation.

    Comparison with other common tumor markers:

    • CA 19-9: More sensitive for pancreatic cancer than CEA
    • CA 15-3 and CA 27.29: More breast cancer-specific than CEA
    • PSA: Prostate-specific, unlike CEA
    • AFP: Specific for liver cancer and germ cell tumors
    • CA-125: Primary marker for ovarian cancer

    In colorectal cancer, CEA remains the cornerstone marker, though some centers also monitor CA 19-9, particularly for mucinous tumors. For pancreatic cancer, both CEA and CA 19-9 provide complementary information, with CA 19-9 generally being more sensitive.

    The choice of tumor markers depends on:

    • Cancer type and histology
    • Available evidence for each marker
    • Cost-effectiveness considerations
    • Laboratory availability
    • Patient-specific factors

    Combining multiple markers sometimes improves sensitivity but may reduce specificity. The clinical context should guide marker selection rather than routinely ordering broad panels without clear indication.

    Can CEA Testing Be Used for Cancer Screening in Healthy People?

    CEA testing has very limited utility for cancer screening in asymptomatic individuals without known cancer risk factors. Multiple studies have demonstrated poor performance characteristics when used for this purpose, leading to potential harm from false positives.

    Reasons CEA is not recommended for general cancer screening:

    • Low sensitivity for early-stage cancer
    • Poor specificity leads to false positives
    • Many benign conditions elevate CEA
    • Lack of evidence showing mortality benefit
    • Potential for unnecessary follow-up testing

    Exceptions where CEA testing might be considered in screening contexts include:

    • High-risk individuals in cancer screening research protocols
    • Patients with specific genetic syndromes increasing cancer risk
    • As part of multidisciplinary assessment in symptomatic patients

    For average-risk individuals, established cancer screening methods remain preferred:

    • Colonoscopy for colorectal cancer
    • Mammography for breast cancer
    • Low-dose CT for lung cancer in high-risk smokers
    • Pap smear and HPV testing for cervical cancer

    The potential psychological harm of false-positive CEA tests, along with the unnecessary medical procedures that might follow, outweighs any theoretical benefit in general population screening.

    What Factors Can Affect CEA Test Results Besides Cancer?

    Multiple physiological, lifestyle, and medical factors influence CEA levels independent of cancer. Recognizing these variables helps clinicians interpret results accurately and avoid misattribution of CEA elevation to cancer when other causes are responsible.

    Key factors affecting CEA levels:

    • Smoking status: Smokers have higher baseline levels
    • Age: Slight increase with advancing age
    • Renal function: Reduced clearance in kidney disease
    • Liver function: Impaired metabolism in liver disease
    • Inflammation: Active inflammatory conditions
    • Medications: Some drugs affect CEA production or clearance
    • Laboratory variations: Different assay methods and reference ranges

    Tobacco use represents the most significant non-cancer factor, with smokers typically having CEA levels 1-2 ng/mL higher than non-smokers. This effect diminishes after smoking cessation but may take months to normalize completely.

    When interpreting CEA results, clinicians should:

    • Document smoking status and history
    • Note concurrent medical conditions
    • Consider timing relative to inflammatory flares
    • Use consistent laboratory for serial monitoring
    • Account for medication changes

    Understanding these confounding factors prevents overinterpretation of mild CEA elevations and guides appropriate follow-up when true concern exists.

    How is CEA Testing Used in Conjunction with Imaging Studies?

    CEA testing and imaging studies provide complementary information in cancer monitoring, with each modality having distinct strengths. The integrated interpretation of both data sources enhances clinical decision-making beyond either alone.

    The role of CEA testing relative to imaging:

    • CEA provides continuous biochemical data between imaging intervals
    • Imaging offers anatomical localization and measurement
    • CEA can detect change earlier than scheduled imaging
    • Imaging confirms findings suggested by CEA elevation
    • Both contribute to comprehensive assessment

    In surveillance protocols, CEA testing typically occurs more frequently than imaging due to lower cost, convenience, and absence of radiation exposure. For example, while CT scans might be scheduled every 6-12 months, CEA testing might occur every 3-6 months.

    When CEA rises without corresponding imaging findings:

    • Repeat CEA to confirm trend
    • Consider more sensitive imaging (PET vs CT)
    • Shorten interval to next imaging
    • Evaluate for non-cancer causes
    • Continue close monitoring

    When imaging shows progression with stable CEA:

    • Confirm CEA trend with repeat testing
    • Consider tumor heterogeneity with non-CEA producing clones
    • Proceed based on imaging findings regardless of CEA
    • Assess treatment options for progressing disease

    The optimal integration of CEA and imaging continues to evolve as both technologies advance and new evidence emerges about their combined utility.

    What Are the Latest Advancements in CEA Testing Technology?

    CEA testing methodology has evolved significantly since its initial discovery, with ongoing improvements in accuracy, sensitivity, and clinical utility. Recent advancements focus on enhancing performance characteristics and expanding applications.

    Current developments in CEA testing:

    • High-sensitivity assays: Detect lower CEA concentrations
    • Automated platforms: Improve reproducibility and throughput
    • Point-of-care testing: Enable rapid results in clinical settings
    • Standardization efforts: Reduce inter-laboratory variability
    • Novel applications: Exploring new cancer types and uses

    Emerging research areas include:

    • CEA ratio measurements (serum vs other fluids)
    • CEA change velocity calculations
    • Combination with other novel biomarkers
    • Genetic markers of CEA production capability
    • Imaging correlates of CEA expression

    Technological innovations improving CEA testing:

    • Microfluidic devices for minimal sample volume
    • Multiplex platforms measuring multiple markers simultaneously
    • Artificial intelligence algorithms for pattern recognition
    • Liquid biopsy applications detecting CEA-producing cells

    While these advancements show promise, implementation in routine clinical practice requires validation in large studies and demonstration of improved patient outcomes compared to current standard approaches.

    How Can Patients Prepare for CEA Testing and Interpret Their Results?

    Patient understanding and engagement in CEA testing enhances its value in cancer care. Educating patients about the purpose, limitations, and interpretation of CEA testing promotes informed participation in their care.

    Patient preparation for CEA testing:

    • No special fasting typically required
    • Inform healthcare provider of all medications
    • Note recent illnesses or inflammatory conditions
    • Consistent timing relative to treatment cycles
    • Use same laboratory for serial tests when possible

    When discussing CEA results with patients:

    • Explain the reference range and its limitations
    • Emphasize trend over single values
    • Place results in clinical context
    • Avoid overinterpretation of small fluctuations
    • Describe next steps based on results

    Patient questions to encourage:

    • What is my CEA trend over time?
    • How does this result affect my treatment plan?
    • When should I be concerned about a change?
    • What other tests will help interpret this result?
    • What symptoms should I report between tests?

    Providing patients with their CEA values and explaining the pattern empowers them to participate actively in their surveillance. Many patients find tracking their CEA trend reassuring and appreciate understanding this objective measure of their disease status.

    Free CEA Cancer Risk Assessment Calculator: How to Use and Interpret Your Results

    Our comprehensive CEA Cancer Risk Assessment Calculator helps individuals understand their potential risk factors for elevated CEA levels and related cancers. This tool integrates multiple clinical parameters to provide personalized risk assessment and guidance.

    The calculator evaluates several risk domains:

    • Demographic factors (age, gender, BMI)
    • Personal medical history (conditions affecting CEA)
    • Family cancer history
    • Lifestyle factors (smoking, alcohol, diet)
    • Current symptoms potentially related to cancer
    • Known CEA levels if available

    How to use the calculator effectively:

    • Provide accurate information for all parameters
    • Complete all sections for comprehensive assessment
    • Review results in context of your overall health
    • Share results with your healthcare provider
    • Use as educational tool rather than diagnostic instrument

    Interpreting your risk score:

    • Low risk (0-30): Continue recommended cancer screenings
    • Moderate risk (31-70): Discuss with healthcare provider
    • High risk (71-100): Prompt medical consultation recommended

    The calculator serves as an educational resource to enhance awareness about CEA-related cancers and risk factors. It should complement rather than replace medical care, with concerning results always prompting professional evaluation.

    What is the Cost and Insurance Coverage for CEA Testing?

    The cost of CEA testing varies based on several factors, including geographic location, healthcare setting, and insurance coverage. Understanding the financial aspects helps patients navigate this aspect of their cancer care.

    Typical CEA test cost ranges:

    • $50-$200 without insurance
    • $20-$50 copay with insurance
    • Often covered completely after deductible met

    Insurance coverage considerations:

    • Medicare covers CEA testing for approved indications
    • Private insurers typically follow Medicare guidelines
    • Preauthorization may be required for frequent testing
    • Coverage may be denied for screening in asymptomatic individuals

    Factors affecting out-of-pocket costs:

    • Insurance plan type and benefits
    • Whether provider is in-network
    • Facility fees at different locations
    • Number of tests performed annually

    Strategies to manage testing costs:

    • Verify insurance coverage before testing
    • Use in-network laboratories when possible
    • Discuss testing frequency with your provider
    • Explore patient assistance programs if uninsured
    • Consider cash prices which may be lower

    When CEA testing is medically necessary for cancer monitoring, insurance typically provides coverage. Patients should understand their benefits and work with their healthcare team to ensure appropriate coverage for recommended testing.

    FAQs: Frequently Asked Questions About CEA Testing

    What is the normal range for CEA blood test?
    The normal range for CEA is typically 0-3.0 ng/mL for non-smokers and 0-5.0 ng/mL for smokers. However, reference ranges may vary slightly between laboratories, so it’s important to compare results to the specific reference range provided by the testing facility.

    Can CEA levels be high without cancer?
    Yes, several non-cancerous conditions can elevate CEA levels, including smoking, inflammatory bowel disease, pancreatitis, liver disease, infections, and other inflammatory conditions. Mild elevations require clinical correlation rather than immediate assumption of cancer.

    How quickly do CEA levels change after cancer treatment?
    CEA levels typically begin to decrease within days to weeks after effective cancer treatment, with the half-life of CEA being approximately 1-2 weeks. The rate of decline depends on the treatment type, tumor characteristics, and initial CEA level.

    What percentage of colon cancer patients have elevated CEA?
    Approximately 70-80% of colorectal cancer patients have elevated CEA levels at diagnosis. The percentage varies by stage, with higher-stage cancers more likely to produce elevated CEA. About 20-30% of colorectal cancers do not produce significant CEA.

    Can CEA levels fluctuate during chemotherapy?
    Yes, CEA levels can fluctuate during chemotherapy. Some treatments may cause temporary CEA elevation due to tumor cell death and marker release (tumor flare). The overall trend over multiple measurements is more important than single values during active treatment.

    How sensitive is CEA testing for detecting cancer recurrence?
    The sensitivity of CEA testing for detecting colorectal cancer recurrence is approximately 58-84%, meaning it misses some recurrences. Specificity is around 70%, meaning some elevations are due to non-cancer causes. CEA testing is most valuable when combined with other surveillance methods.

    Should I get CEA testing if I have a family history of cancer?
    Routine CEA testing is not recommended for cancer screening even with family history. Established screening methods like colonoscopy for colorectal cancer risk are more appropriate. CEA testing may be considered in specific high-risk genetic syndromes under medical guidance.

    Disclaimer

    This article provides educational information only and should not replace professional medical advice. The CEA calculator offers risk assessment based on statistical models rather than definitive diagnosis. Always consult healthcare providers for medical concerns.